OPEN-SOURCE SCRIPT
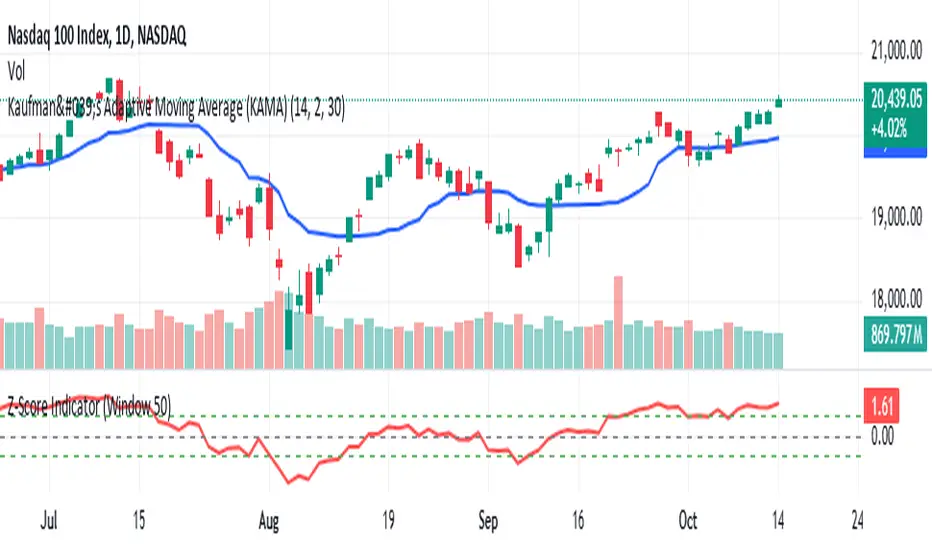
Kaufman's Adaptive Moving Average (KAMA)

Another simple easy to use indicator that incorporates mean reversion and trend following.
Kaufman's Adaptive Moving Average (KAMA) is an indicator developed by Perry Kaufman that adjusts its sensitivity based on market volatility. It is designed to react more quickly during trending markets and slow down in sideways or volatile markets. The primary idea is that in a trending market, the moving average should be more sensitive to price changes, while in a non-trending market, it should be less responsive to noise.
KAMA Formula
The formula for the Kaufman Adaptive Moving Average is:
Efficiency Ratio (ER): Measures the efficiency of price movement over a given period.
ER
=
Smoothing Factor
Volatility
=
Sum of absolute price change
Sum of absolute price movement
ER=
Volatility
Smoothing Factor
=
Sum of absolute price movement
Sum of absolute price change
The Efficiency Ratio is calculated by taking the price change over a defined period and dividing it by the total price movement (which is the sum of absolute price changes).
Smoothing Constant (SC): This is a factor used to adjust the moving average's responsiveness:
SC
=
ER
×
(
2
/
(
𝑛
+
1
)
)
+
(
1
−
ER
)
×
(
2
/
(
𝑛
+
1
)
)
SC=ER×(2/(n+1))+(1−ER)×(2/(n+1))
where n is the length of the moving average period.
Steps to Calculate KAMA:
Efficiency Ratio (ER):
Calculate the sum of absolute price changes over the chosen period.
Calculate the sum of absolute price movements over the same period.
Smoothing Constant (SC):
Use the Efficiency Ratio to adjust the smoothing factor.
KAMA Calculation:
The initial KAMA is the simple moving average (SMA) of the first n periods.
For subsequent periods, KAMA is calculated using a formula based on the smoothing constant and previous KAMA values.
experiment with the variables as you like!!
Скрипт с открытым кодом
В истинном духе TradingView, создатель этого скрипта сделал его открытым исходным кодом, чтобы трейдеры могли проверить и убедиться в его функциональности. Браво автору! Вы можете использовать его бесплатно, но помните, что перепубликация кода подчиняется нашим Правилам поведения.
Отказ от ответственности
Информация и публикации не предназначены для предоставления и не являются финансовыми, инвестиционными, торговыми или другими видами советов или рекомендаций, предоставленных или одобренных TradingView. Подробнее читайте в Условиях использования.