OPEN-SOURCE SCRIPT
Обновлено VWMA True Range | Lyro RS
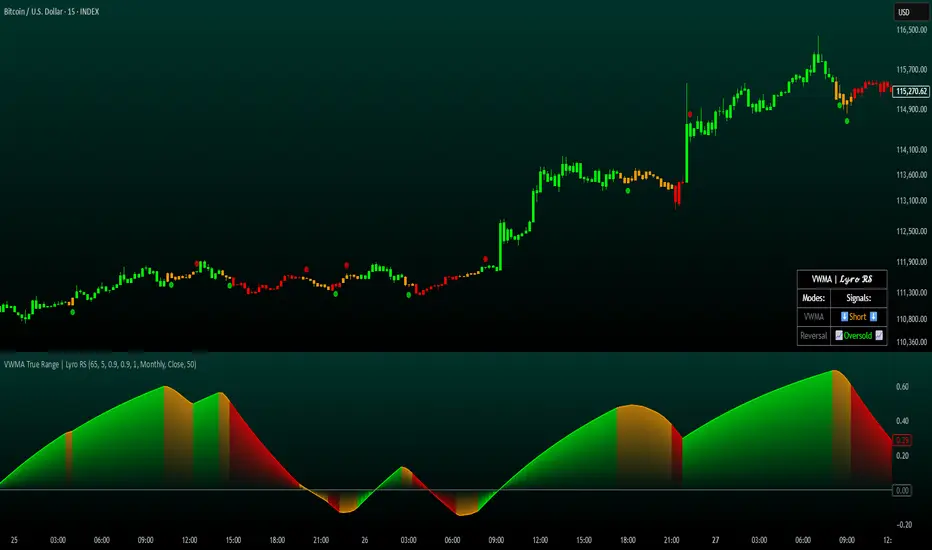
VWMA True Range | Lyro RS
This script is a hybrid technical analysis tool designed to identify trends and spot potential reversals. It employs a consensus-based system that uses multiple smoothed, Volume-Weighted Moving Averages (VWMA) to generate both trend-following and counter-trend signals.
Understanding the Indicator's Components
The indicator plots a main line on a separate pane and provides visual alerts directly on the chart.
The Main Line: This line represents a smoothed average of momentum scores derived from multiple VWMAs. Its direction and value are the foundation of the analysis.

Signal Generation: The tool provides two distinct types of signals:
Trend Signals: These trend-following signals ("⬆️Long" / "⬇️Short") activate when the indicator's consensus reaches a pre-set strength threshold, indicating sustained momentum in one direction.
Reversal Signals: These counter-trend alerts ("📈Oversold" / "📉Overbought") trigger when the main line breaks a previous period's level, hinting at exhaustion and a potential short-term reversal.

Visual Alerts:
Colored Background: The indicator's background highlights during strong trend signals for added visual emphasis.
Chart Shapes: Small circles appear on the main chart to mark where potential reversals are detected.
Colored Candles: You can choose to color the price candles to reflect the current trend signal.
Information Table: A compact table provides an at-a-glance summary of all currently active signals.

Suggested Use and Interpretation
Here are a few ways to incorporate this indicator into your analysis:
Following the Trend: Use the "Long" or "Short" trend signals to align your trades with the prevailing market momentum.
Spotting Reversals: Watch for "Oversold" or "Overbought" reversal signals, often accompanied by chart shapes, to identify potential market turning points.
Combining Signals: Use the primary trend signal for context and look for reversal signals that may indicate a pullback within the larger trend, potentially offering favorable entry points.
Customization Options:
You can tailor the indicator's behavior and appearance through several settings:
Core Settings: Adjust the Calculation Period and Smooth Length to make the main line more or less responsive to price movements.
Signal Thresholds: Fine-tune the Long threshold and Short threshold to control how easily trend signals are triggered.
Visual Settings: Toggle various visual elements like the indicator band, candle coloring, and the information table on or off.
Table Settings: Customize where the information table appears and its size to suit your chart layout.
⚠️Disclaimer
This indicator is a tool for technical analysis and does not guarantee future results. It should be used as part of a comprehensive trading strategy that includes other analysis techniques and strict risk management. The creators are not responsible for any financial decisions made based on its signals.
This script is a hybrid technical analysis tool designed to identify trends and spot potential reversals. It employs a consensus-based system that uses multiple smoothed, Volume-Weighted Moving Averages (VWMA) to generate both trend-following and counter-trend signals.
Understanding the Indicator's Components
The indicator plots a main line on a separate pane and provides visual alerts directly on the chart.
The Main Line: This line represents a smoothed average of momentum scores derived from multiple VWMAs. Its direction and value are the foundation of the analysis.
Signal Generation: The tool provides two distinct types of signals:
Trend Signals: These trend-following signals ("⬆️Long" / "⬇️Short") activate when the indicator's consensus reaches a pre-set strength threshold, indicating sustained momentum in one direction.
Reversal Signals: These counter-trend alerts ("📈Oversold" / "📉Overbought") trigger when the main line breaks a previous period's level, hinting at exhaustion and a potential short-term reversal.
Visual Alerts:
Colored Background: The indicator's background highlights during strong trend signals for added visual emphasis.
Chart Shapes: Small circles appear on the main chart to mark where potential reversals are detected.
Colored Candles: You can choose to color the price candles to reflect the current trend signal.
Information Table: A compact table provides an at-a-glance summary of all currently active signals.
Suggested Use and Interpretation
Here are a few ways to incorporate this indicator into your analysis:
Following the Trend: Use the "Long" or "Short" trend signals to align your trades with the prevailing market momentum.
Spotting Reversals: Watch for "Oversold" or "Overbought" reversal signals, often accompanied by chart shapes, to identify potential market turning points.
Combining Signals: Use the primary trend signal for context and look for reversal signals that may indicate a pullback within the larger trend, potentially offering favorable entry points.
Customization Options:
You can tailor the indicator's behavior and appearance through several settings:
Core Settings: Adjust the Calculation Period and Smooth Length to make the main line more or less responsive to price movements.
Signal Thresholds: Fine-tune the Long threshold and Short threshold to control how easily trend signals are triggered.
Visual Settings: Toggle various visual elements like the indicator band, candle coloring, and the information table on or off.
Table Settings: Customize where the information table appears and its size to suit your chart layout.
⚠️Disclaimer
This indicator is a tool for technical analysis and does not guarantee future results. It should be used as part of a comprehensive trading strategy that includes other analysis techniques and strict risk management. The creators are not responsible for any financial decisions made based on its signals.
Информация о релизе
Update: Added design, fixed table.Скрипт с открытым кодом
В истинном духе TradingView, создатель этого скрипта сделал его открытым исходным кодом, чтобы трейдеры могли проверить и убедиться в его функциональности. Браво автору! Вы можете использовать его бесплатно, но помните, что перепубликация кода подчиняется нашим Правилам поведения.
Get access to our private indicators & analysis: whop.com/lyro-rs
Join our community: discord.gg/kcEBMWaFjS
All material from Lyro RS is for educational purposes only. Past performance does not guarantee future results.
Join our community: discord.gg/kcEBMWaFjS
All material from Lyro RS is for educational purposes only. Past performance does not guarantee future results.
Отказ от ответственности
Информация и публикации не предназначены для предоставления и не являются финансовыми, инвестиционными, торговыми или другими видами советов или рекомендаций, предоставленных или одобренных TradingView. Подробнее читайте в Условиях использования.
Скрипт с открытым кодом
В истинном духе TradingView, создатель этого скрипта сделал его открытым исходным кодом, чтобы трейдеры могли проверить и убедиться в его функциональности. Браво автору! Вы можете использовать его бесплатно, но помните, что перепубликация кода подчиняется нашим Правилам поведения.
Get access to our private indicators & analysis: whop.com/lyro-rs
Join our community: discord.gg/kcEBMWaFjS
All material from Lyro RS is for educational purposes only. Past performance does not guarantee future results.
Join our community: discord.gg/kcEBMWaFjS
All material from Lyro RS is for educational purposes only. Past performance does not guarantee future results.
Отказ от ответственности
Информация и публикации не предназначены для предоставления и не являются финансовыми, инвестиционными, торговыми или другими видами советов или рекомендаций, предоставленных или одобренных TradingView. Подробнее читайте в Условиях использования.