OPEN-SOURCE SCRIPT
Pre-Market High and Low
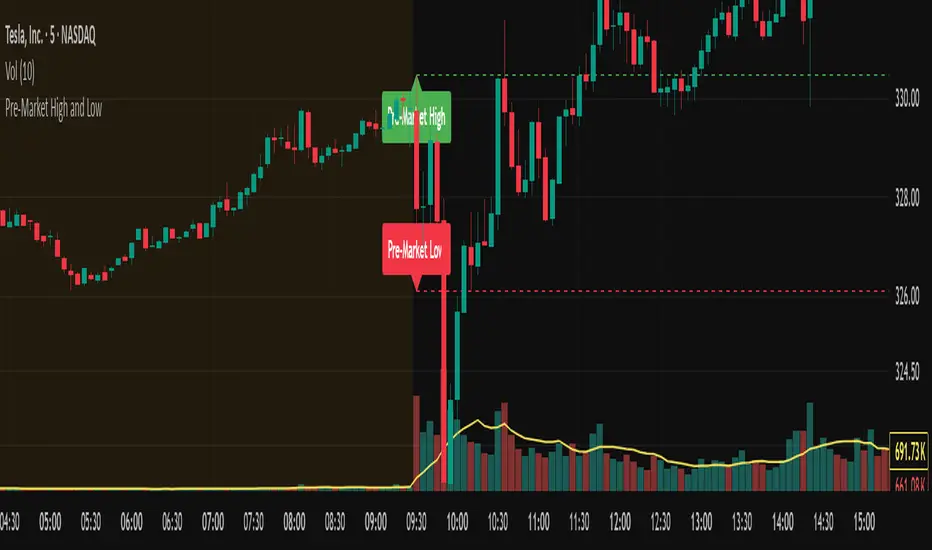
This indicator automatically tracks and plots the daily pre-market high and low levels on your chart for U.S. stocks. It monitors the pre-market session from 4:30 AM to 9:30 AM Eastern Time (New York) and captures the highest and lowest prices during this period.
At exactly 9:30 AM ET, when the regular market opens, the indicator draws dashed horizontal lines representing the pre-market high and pre-market low, extending them forward for better visibility throughout the trading day.
At exactly 9:30 AM ET, when the regular market opens, the indicator draws dashed horizontal lines representing the pre-market high and pre-market low, extending them forward for better visibility throughout the trading day.
Скрипт с открытым кодом
В истинном духе TradingView, создатель этого скрипта сделал его открытым исходным кодом, чтобы трейдеры могли проверить и убедиться в его функциональности. Браво автору! Вы можете использовать его бесплатно, но помните, что перепубликация кода подчиняется нашим Правилам поведения.
Отказ от ответственности
Информация и публикации не предназначены для предоставления и не являются финансовыми, инвестиционными, торговыми или другими видами советов или рекомендаций, предоставленных или одобренных TradingView. Подробнее читайте в Условиях использования.