OPEN-SOURCE SCRIPT
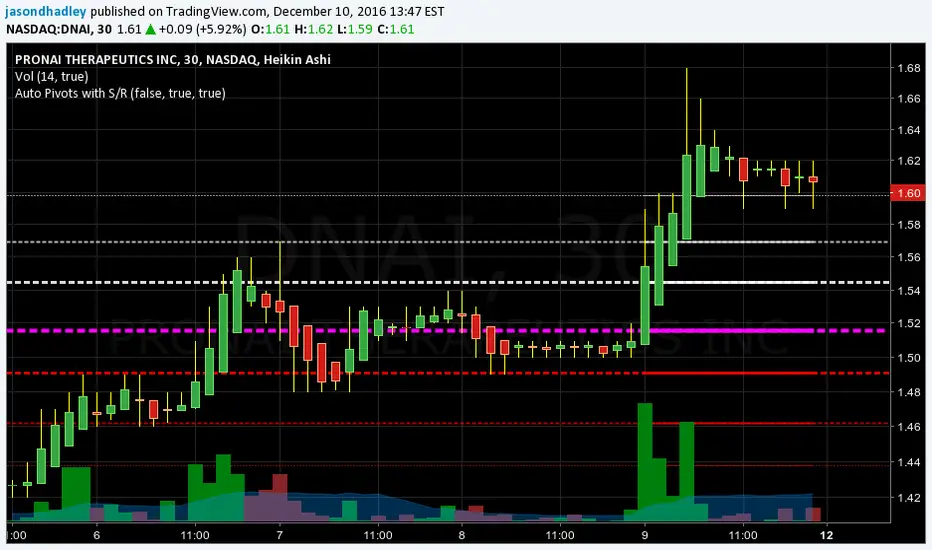
Auto Pivots with S/R Levels

Plots out the pivot point with corresponding Support / Resistance levels.
It will automatically determine the time frame to calculate pivots based on the current view resolution.
Monthly resolution will pull a yearly pivot
Weekly resolution will pull a monthly pivot
Daily view will pull a weekly pivot
Intraday view will pull a daily pivot.
You have the choice of using Standard pivots or Fibonacci pivots
You can choose to only display the most recent pivot or all pivots
You can chose to extend the most recent pivot across the whole chart as a price line
TODO:
- Add in the ability to choose how far back historically to display pivots
- Add in calculations for smaller resolutions to calculate off lower time frames. EX: minute resolution should pull hour time frame to calculate pivots.
Скрипт с открытым кодом
В истинном духе TradingView, создатель этого скрипта сделал его открытым исходным кодом, чтобы трейдеры могли проверить и убедиться в его функциональности. Браво автору! Вы можете использовать его бесплатно, но помните, что перепубликация кода подчиняется нашим Правилам поведения.
Отказ от ответственности
Информация и публикации не предназначены для предоставления и не являются финансовыми, инвестиционными, торговыми или другими видами советов или рекомендаций, предоставленных или одобренных TradingView. Подробнее читайте в Условиях использования.