PROTECTED SOURCE SCRIPT
Assets Correlation by GDM

📊 Correlation Matrix Table between Two Assets
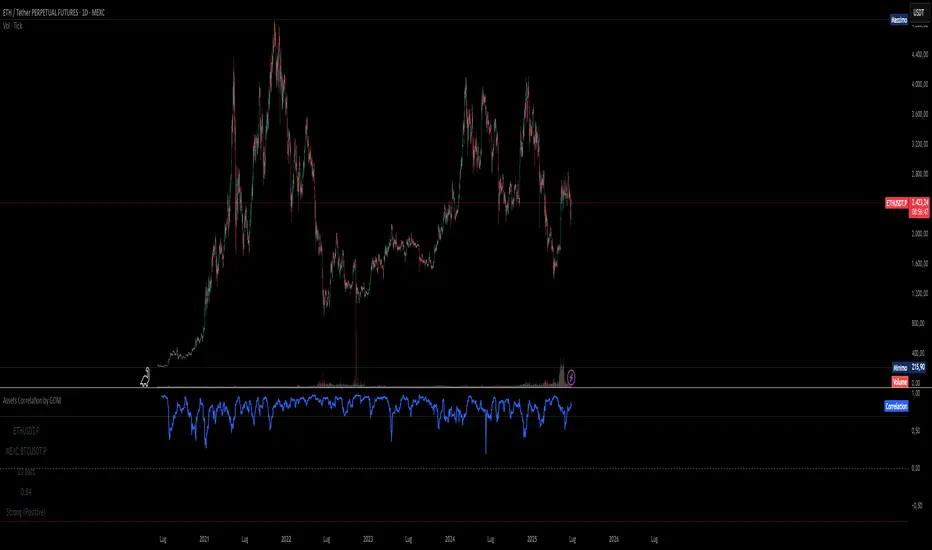
This indicator calculates and displays the rolling correlation between the asset on your chart and a second asset of your choice. The correlation is computed based on log returns over a user-defined lookback period. A live summary table appears in the bottom left corner, providing a real-time snapshot of the current correlation and its context.
How it works:
Comparison Asset:
Select any symbol to compare with the chart asset (e.g., compare BTCUSD to ETHUSD).
Lookback Period:
Choose the rolling window (in bars) used to calculate the Pearson correlation coefficient.
Dynamic Table:
A table in the lower left corner summarizes:
Main asset symbol
Comparison symbol
Analysis period (bars)
Current correlation value (rounded to 2 decimals)
Correlation strength & direction (Strong, Moderate, Weak | Positive/Negative)
Visual Plot:
The indicator plots the correlation value over time so you can observe changes and trends.
Table Positioning:
Table location can be adjusted from settings (bottom left/right, top left/right).
How to use:
Risk Management & Diversification:
Quickly assess if two assets move together (positive correlation), in opposite directions (negative correlation), or independently.
Pairs Trading:
Identify opportunities when correlation diverges from historical norms.
Portfolio Construction:
Avoid overexposure to highly correlated assets, or use negative correlation for hedging.
Limitations & Tips:
Correlation values are based on historical returns and may change during periods of market stress or volatility.
Use multiple lookback periods (short, medium, long) for a more robust view.
Correlation does not imply causation—always complement with additional analysis.
Script Features:
User-selectable comparison asset and lookback window.
Real-time correlation calculation.
Clean summary table with correlation stats.
Optional alert logic and correlation plot for more advanced usage.
If you find this indicator useful, please leave a like and let me know your suggestions for improvements!
Скрипт с защищённым кодом
Этот скрипт опубликован с закрытым исходным кодом. Однако вы можете использовать его свободно и без каких-либо ограничений — читайте подробнее здесь.
Отказ от ответственности
Информация и публикации не предназначены для предоставления и не являются финансовыми, инвестиционными, торговыми или другими видами советов или рекомендаций, предоставленных или одобренных TradingView. Подробнее читайте в Условиях использования.