PROTECTED SOURCE SCRIPT
BASED Momentum Oscillator
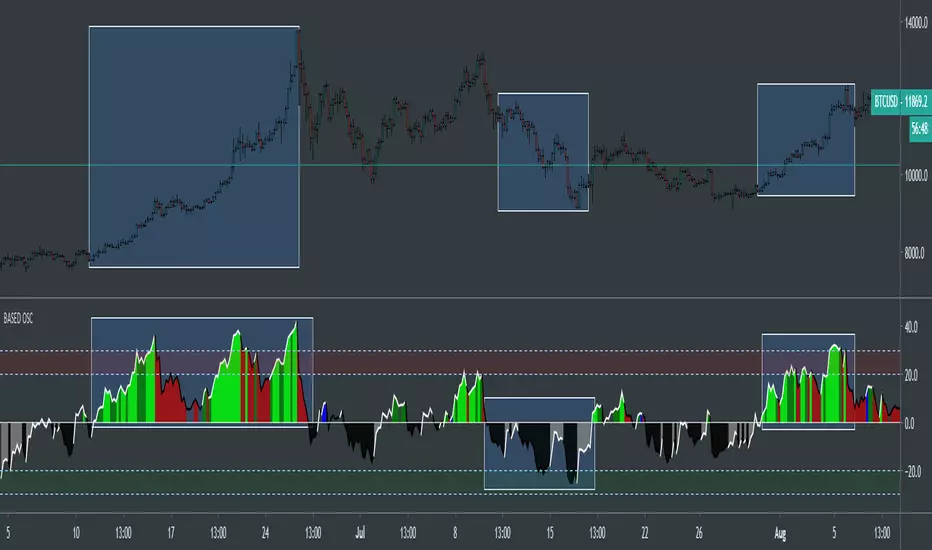
This is the BASED Momentum Oscillator. I have been working on this for awhile and it's been working really great! Can be used on any security on any timeframe. Spot entries during a bullish or bearish trend, oversold and overbought conditions, can be used to spot divergences.
When the oscillator reaches the red area on top, it means the security is entering overbought conditions. When the oscillator reaches the green area at bottom, it means the security is entering oversold conditions.
Lime = Strong uptrend
Green = Uptrend
Blue = Neutral uptrend
Red = Declining uptrend
Black = Bearish decline
Grey = Cautious recovery from Bearish decline
Blank Area = no signal
Should be used with two more indicators for confirmation.
Enjoy!
Скрипт с защищённым кодом
Этот скрипт опубликован с закрытым исходным кодом. Однако вы можете использовать его свободно и без каких-либо ограничений — читайте подробнее здесь.
Отказ от ответственности
Информация и публикации не предназначены для предоставления и не являются финансовыми, инвестиционными, торговыми или другими видами советов или рекомендаций, предоставленных или одобренных TradingView. Подробнее читайте в Условиях использования.