OPEN-SOURCE SCRIPT
Ehlers Early Onset Trend
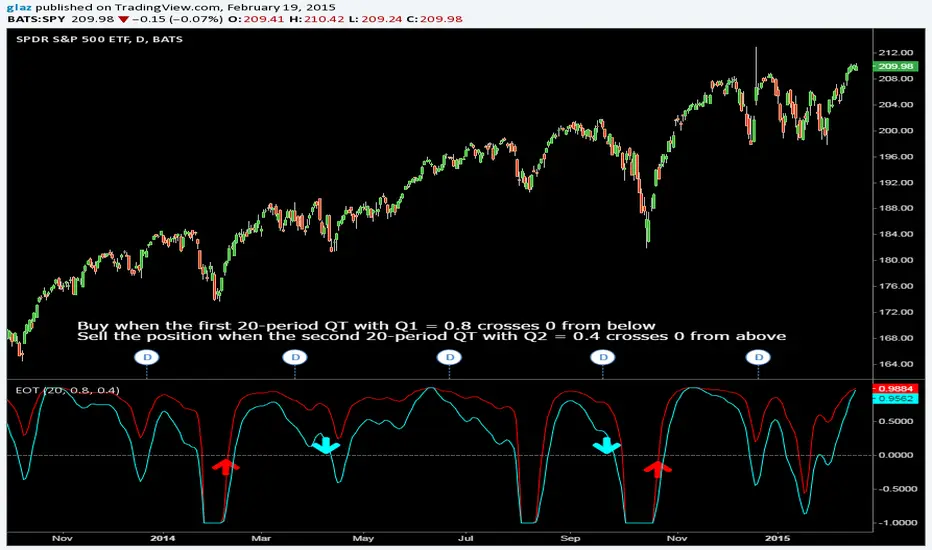
In his article in this issue, “The Quotient Transform,” author John Ehlers introduces the quotient transform (QT), a zero-lag filter that can be used for the purpose of timely trend detection. The QT is an advancement of the technique he presented in his January 2014 S&C article, “Predictive And Successful Indicators.” This time, the output of a roofing filter (which includes applying a high-pass filter and SuperSmoother filter) is normalized.
Code and other platforms traders.com/documentation/feedbk_docs/2014/08/TradersTips.html
Pinescript code Glaz and LazyBear
Code and other platforms traders.com/documentation/feedbk_docs/2014/08/TradersTips.html
Pinescript code Glaz and LazyBear
Скрипт с открытым кодом
В истинном духе TradingView, создатель этого скрипта сделал его открытым исходным кодом, чтобы трейдеры могли проверить и убедиться в его функциональности. Браво автору! Вы можете использовать его бесплатно, но помните, что перепубликация кода подчиняется нашим Правилам поведения.
Отказ от ответственности
Информация и публикации не предназначены для предоставления и не являются финансовыми, инвестиционными, торговыми или другими видами советов или рекомендаций, предоставленных или одобренных TradingView. Подробнее читайте в Условиях использования.