OPEN-SOURCE SCRIPT
Обновлено TICK Charting & Divergences
Overview
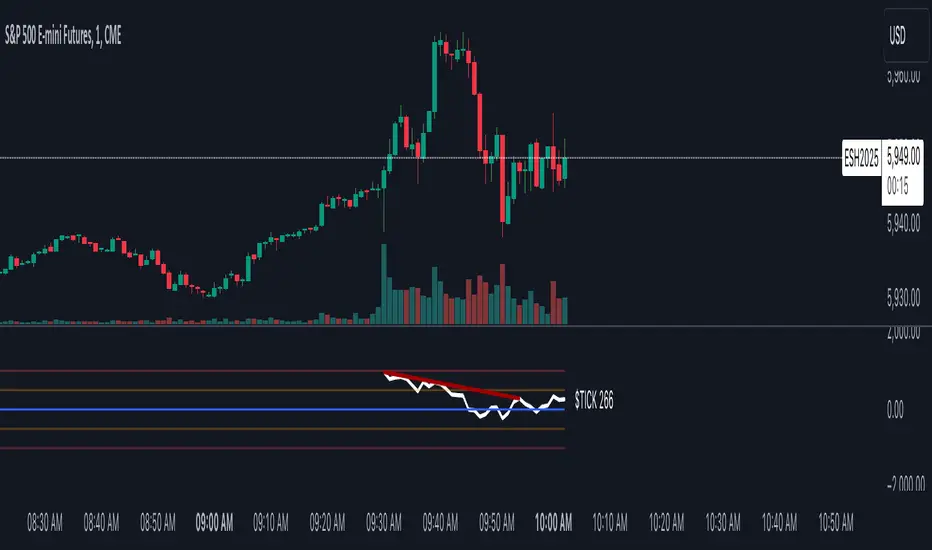
The TICK index measures the number of NYSE stocks making an uptick versus a downtick. This indicator identifies divergences between price action and TICK readings, potentially signaling trend reversals.
Key Features
TICK Internals Interpretation
Best Practices
Settings Optimization
Warning Signs
Remember: TICK divergences are not guaranteed signals. Always use proper risk management and combine with other technical analysis tools.
The TICK index measures the number of NYSE stocks making an uptick versus a downtick. This indicator identifies divergences between price action and TICK readings, potentially signaling trend reversals.
Key Features
- Real-time TICK monitoring during market hours (9:30 AM - 4:00 PM ET)
- Customizable smoothing factor for TICK values
- Regular and hidden divergences detection
- Reference lines at ±500 and ±1000 levels
- Current TICK value display
TICK Internals Interpretation
- Above +1000: Strong buying pressure, potential exhaustion
- Above +500: Moderate buying pressure
- Below -500: Moderate selling pressure
- Below -1000: Strong selling pressure, potential exhaustion
Best Practices
- Use in conjunction with support/resistance levels, market trend direction, and time of day.
- Higher probability setups with multiple timeframe confirmation, divergence at key price levels, and extreme TICK readings (±1000).
Settings Optimization
- Smoothing Factor: 1-3 (lower for faster signals)
- Pivot Lookback: 5-10 bars (adjust based on timeframe)
- Range: 5-60 bars (wider for longer-term signals)
Warning Signs
- Multiple failed divergences
- Choppy price action
- Low volume periods
- Major news events pending
Remember: TICK divergences are not guaranteed signals. Always use proper risk management and combine with other technical analysis tools.
Информация о релизе
Updated with better chart image.Информация о релизе
Updated naming in indicator pane.Скрипт с открытым кодом
В истинном духе TradingView, создатель этого скрипта сделал его открытым исходным кодом, чтобы трейдеры могли проверить и убедиться в его функциональности. Браво автору! Вы можете использовать его бесплатно, но помните, что перепубликация кода подчиняется нашим Правилам поведения.
Отказ от ответственности
Информация и публикации не предназначены для предоставления и не являются финансовыми, инвестиционными, торговыми или другими видами советов или рекомендаций, предоставленных или одобренных TradingView. Подробнее читайте в Условиях использования.
Скрипт с открытым кодом
В истинном духе TradingView, создатель этого скрипта сделал его открытым исходным кодом, чтобы трейдеры могли проверить и убедиться в его функциональности. Браво автору! Вы можете использовать его бесплатно, но помните, что перепубликация кода подчиняется нашим Правилам поведения.
Отказ от ответственности
Информация и публикации не предназначены для предоставления и не являются финансовыми, инвестиционными, торговыми или другими видами советов или рекомендаций, предоставленных или одобренных TradingView. Подробнее читайте в Условиях использования.