OPEN-SOURCE SCRIPT
Revolution SMA-EMA Divergence
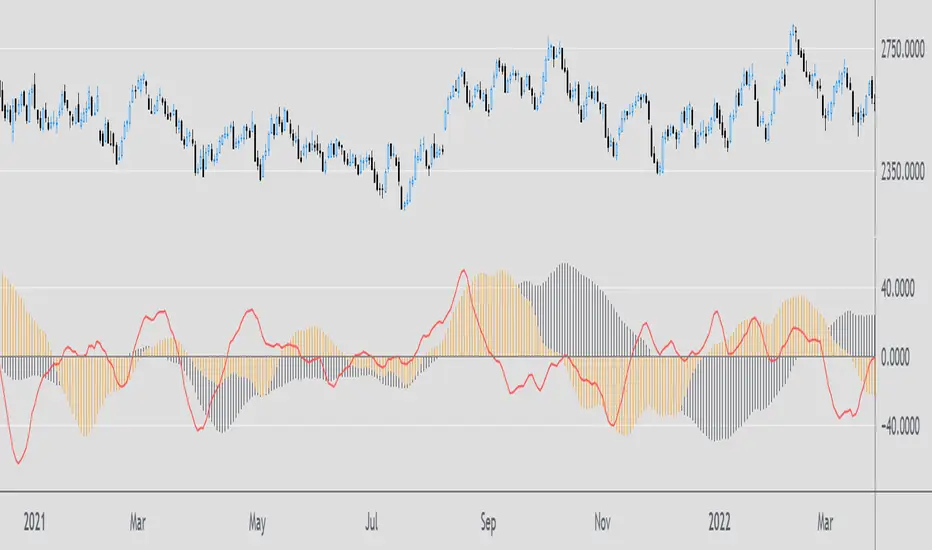
This is an MACD inspired indicator and it analyzes the difference between the SMA and EMA using the same time period. Unlike the MACD, it can give you a better understanding of the overall trend. Values above 0 is bullish and below 0 bearish. It consists of two cycles: Black histogram - the long-term cycle and orange histogram - the short-term cycle, as well as timing signal (red line).
Скрипт с открытым кодом
В истинном духе TradingView, создатель этого скрипта сделал его открытым исходным кодом, чтобы трейдеры могли проверить и убедиться в его функциональности. Браво автору! Вы можете использовать его бесплатно, но помните, что перепубликация кода подчиняется нашим Правилам поведения.
Отказ от ответственности
Информация и публикации не предназначены для предоставления и не являются финансовыми, инвестиционными, торговыми или другими видами советов или рекомендаций, предоставленных или одобренных TradingView. Подробнее читайте в Условиях использования.