PROTECTED SOURCE SCRIPT
ORB Algo - Bitcoin
GENERAL SUMMARY
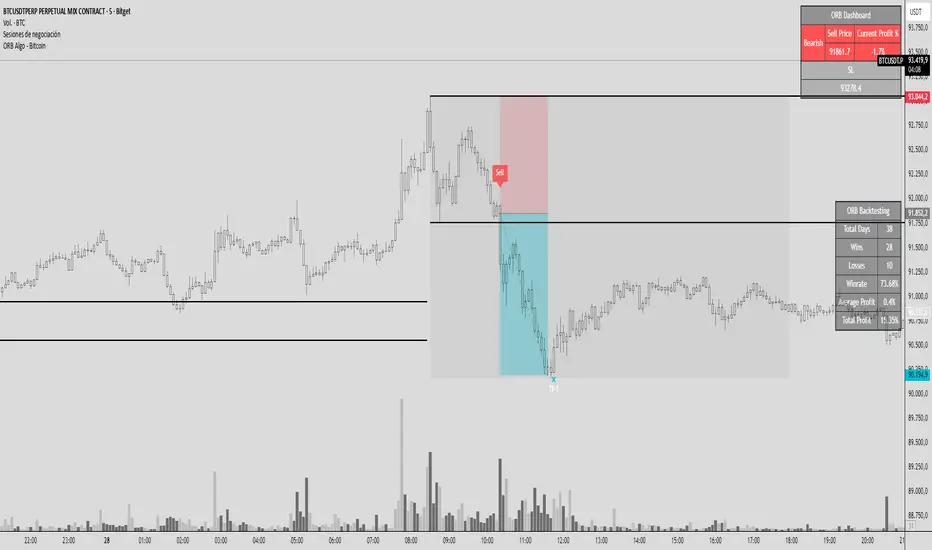
We present our new ORB Algo indicator! ORB stands for "Opening Range Breakout," a common trading strategy. The indicator can analyze the market trend in the current session and generate Buy/Sell, Take Profit, and Stop Loss signals. For more information about the indicator's analysis process, you can read the “How Does It Work?” section of the description.
Features of the new ORB Algo indicator:
Buy/Sell Signals
Up to 3 Take Profit Signals
Stop Loss Signals
Buy/Sell, Take Profit, and Stop Loss Alerts
Fully Customizable Algorithm
Session Control Panel
Backtesting Control Panel
HOW DOES IT WORK?
This indicator works best on the 1-minute timeframe. The idea is that the trend of the current session can be predicted by analyzing the market for a period of time after the session begins. However, each market has its own dynamics, and the algorithm will require fine-tuning to achieve the best possible performance. For this reason, we implemented a Backtesting Panel that shows the past performance of the algorithm on the current ticker with your current settings. Always remember that past performance does not guarantee future results.
Here are the steps of the algorithm explained briefly:
The algorithm follows and analyzes the first 30 minutes (adjustable) of the session.
Then, it checks for breakouts above or below the opening range high or low.
If a breakout occurs in either direction, the algorithm will look for retests of the breakout. Depending on the sensitivity setting, there must be 0 / 1 / 2 / 3 failed retests for the breakout to be considered reliable.
If the breakout is reliable, the algorithm will issue an entry signal.
After entering the position, the algorithm will wait for the Take-Profit or Stop-Loss zones to be reached and send a signal if any of them occur.
If you wonder how the indicator determines the Take-Profit and Stop-Loss zones, you can check the Settings section of the description.
UNIQUENESS
Although some indicators display the opening range of the session, they often fall short in features such as indicating breakouts, entries, and Take-Profit & Stop-Loss zones. We are also aware that different markets have different dynamics, and tuning the algorithm for each market is crucial for better results. That is why we decided to make the algorithm fully customizable.
In addition to this, our indicator includes a detailed backtesting panel so you can see the past performance of the algorithm on the current ticker. While past performance does not guarantee future results, we believe that a backtesting panel is necessary to fine-tune the algorithm. Another strength of the indicator is that it offers multiple options for detecting Take-Profit and Stop-Loss zones, allowing traders to choose the one that fits their style best.
⚙️ SETTINGS
Keep in mind that the best timeframe for this indicator is the 1-minute timeframe.
TP = Take-Profit
SL = Stop-Loss
EMA = Exponential Moving Average
OR = Opening Range
ATR = Average True Range
1. Algorithm
ORB Timeframe → This setting determines how long the algorithm will analyze the market after a new session begins before issuing signals. It is important to experiment with this option and find the optimal setting for the current ticker. More volatile stocks will require a higher value, while more stable stocks can use a shorter one.
Sensitivity → Determines how many failed retests are required before taking an entry. Higher sensitivity means fewer retests are needed to consider the breakout reliable.
If you believe the ticker makes strong moves after breaking out, use high sensitivity.
If the ticker doesn’t define the trend immediately after a breakout, use low sensitivity.
(High = 0 Retests, Medium = 1 Retest, Low = 2 Retests, Lowest = 3 Retests)
Breakout Condition → Determines how the algorithm detects breakouts.
Close = The bar must close above OR High for bullish breakouts or below OR Low for bearish breakouts.
EMA = The bar’s EMA must be above/below the OR Lines instead of relying on the closing price.
TP Method → Method used to determine TP zones.
Dynamic = Searches for the bar where price stops following the current trend and reverses. It uses an EMA, and when the bar’s close crosses the EMA, a TP is placed.
ATR = Determines TP zones before the trade happens, using the ATR of the entry bar. This option also displays the TP zones on the ORB panel.
→ The Dynamic method generally performs better, while the ATR method is safer and more conservative.
EMA Length → Sets the length of the EMA used in both the Dynamic TP method and the “EMA Breakout Condition.” The default value usually performs well, but you can experiment to find the optimal length for the current ticker.
Stop-Loss → Defines where the SL zone will be placed.
Safer = SL is placed closer to OR High in bullish entries and closer to OR Low in bearish entries.
Balanced = SL is placed in the middle of OR High & OR Low.
Risky = SL is placed farther away, giving more room for movement.
Adaptive SL → Activates only if the first TP zone is reached.
Enabled = After the 1st TP hits, SL moves to the entry price, making the position risk-free.
Disabled = SL never changes.
Скрипт с защищённым кодом
Этот скрипт опубликован с закрытым исходным кодом. Однако вы можете использовать его свободно и без каких-либо ограничений — читайте подробнее здесь.
Отказ от ответственности
Информация и публикации не предназначены для предоставления и не являются финансовыми, инвестиционными, торговыми или другими видами советов или рекомендаций, предоставленных или одобренных TradingView. Подробнее читайте в Условиях использования.