OPEN-SOURCE SCRIPT
Inverted USDT Dominance

Inverted USDT Dominance Indicator
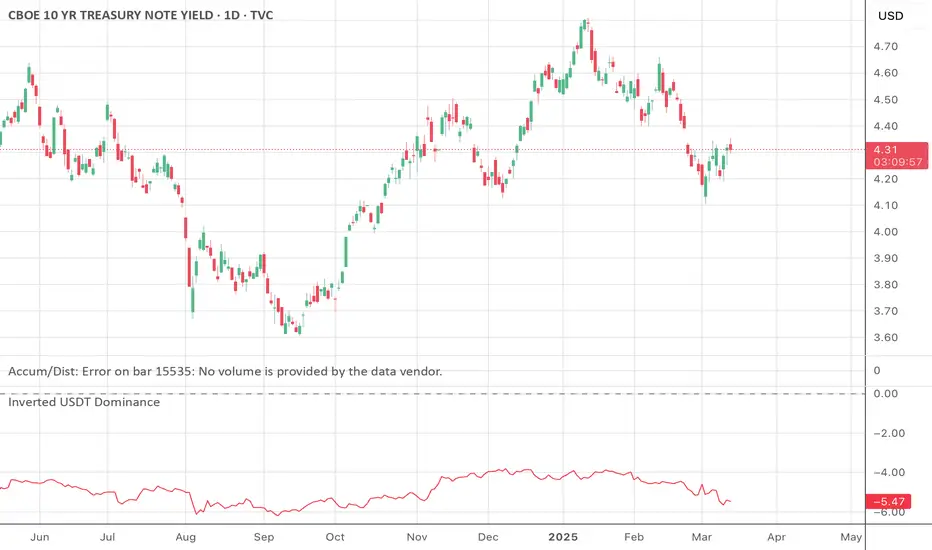
This simple yet powerful indicator plots the inverted USDT Dominance (USDT.D), making it visually intuitive to analyze market sentiment shifts. Typically, USDT dominance rises when investors seek stability, indicating a "risk-off" market environment. Conversely, it falls when investors pursue riskier assets like cryptocurrencies, signaling a "risk-on" environment.
Why invert the USDT Dominance chart?
By flipping USDT Dominance around the zero line, this indicator allows traders and investors to more clearly visualize its correlation and divergence with traditional market indicators like the 10-year Treasury yield (TNX), Bitcoin, or equity indices. A rising line on this inverted indicator intuitively indicates increasing market risk appetite, whereas a falling line highlights growing risk aversion.
Use cases:
Quickly visualize market sentiment (risk-on vs. risk-off).
Identify divergences and correlations between crypto markets and traditional financial instruments.
Enhance portfolio allocation decisions by clearly seeing sentiment changes.
Скрипт с открытым кодом
В истинном духе TradingView, создатель этого скрипта сделал его открытым исходным кодом, чтобы трейдеры могли проверить и убедиться в его функциональности. Браво автору! Вы можете использовать его бесплатно, но помните, что перепубликация кода подчиняется нашим Правилам поведения.
Отказ от ответственности
Информация и публикации не предназначены для предоставления и не являются финансовыми, инвестиционными, торговыми или другими видами советов или рекомендаций, предоставленных или одобренных TradingView. Подробнее читайте в Условиях использования.