OPEN-SOURCE SCRIPT
ATR Clouds
*Updated with Version 5*
ATR Clouds
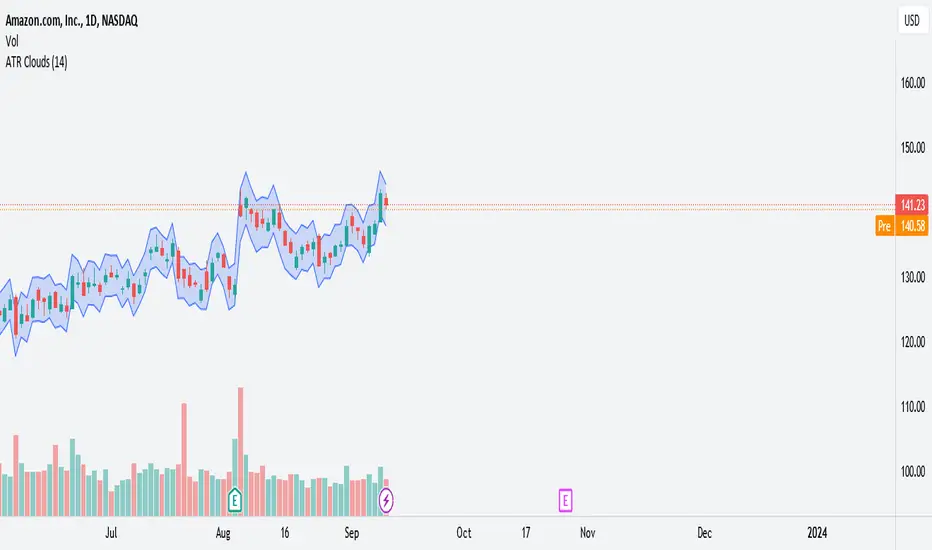
The "ATR Clouds" indicator provides a visual representation of the stock's volatility based on the Average True Range (ATR) calculation. It operates by plotting two bands around the closing price of a stock, using the ATR as a measure of volatility.
Features:
ATR Calculation: The Average True Range is a commonly used metric to understand the volatility of an asset. The indicator calculates the ATR over a user-defined period, with the default being 14 periods.
ATR Bands: Using the ATR value, the script defines two bands:
Upper Band: This is calculated by adding the ATR value to the closing price of the stock. It represents a higher volatility boundary.
Lower Band: This is derived by subtracting the ATR value from the closing price. It indicates a lower volatility boundary.
Cloud Visualization: The space between the upper and lower bands is shaded to create a "cloud" on the chart. This cloud gives traders a clear visual cue of the stock's current volatility range. The cloud has an 80% transparency, allowing the underlying price chart to remain visible.
Customization: Users have the ability to adjust the period for the ATR calculation based on their preferences.
Usage:
Traders can use the ATR Clouds indicator to get a sense of the stock's volatility. Wider clouds indicate periods of higher volatility, while narrower clouds suggest lower volatility. This can be beneficial for se
ATR Clouds
The "ATR Clouds" indicator provides a visual representation of the stock's volatility based on the Average True Range (ATR) calculation. It operates by plotting two bands around the closing price of a stock, using the ATR as a measure of volatility.
Features:
ATR Calculation: The Average True Range is a commonly used metric to understand the volatility of an asset. The indicator calculates the ATR over a user-defined period, with the default being 14 periods.
ATR Bands: Using the ATR value, the script defines two bands:
Upper Band: This is calculated by adding the ATR value to the closing price of the stock. It represents a higher volatility boundary.
Lower Band: This is derived by subtracting the ATR value from the closing price. It indicates a lower volatility boundary.
Cloud Visualization: The space between the upper and lower bands is shaded to create a "cloud" on the chart. This cloud gives traders a clear visual cue of the stock's current volatility range. The cloud has an 80% transparency, allowing the underlying price chart to remain visible.
Customization: Users have the ability to adjust the period for the ATR calculation based on their preferences.
Usage:
Traders can use the ATR Clouds indicator to get a sense of the stock's volatility. Wider clouds indicate periods of higher volatility, while narrower clouds suggest lower volatility. This can be beneficial for se
Скрипт с открытым кодом
В истинном духе TradingView, создатель этого скрипта сделал его открытым исходным кодом, чтобы трейдеры могли проверить и убедиться в его функциональности. Браво автору! Вы можете использовать его бесплатно, но помните, что перепубликация кода подчиняется нашим Правилам поведения.
Отказ от ответственности
Информация и публикации не предназначены для предоставления и не являются финансовыми, инвестиционными, торговыми или другими видами советов или рекомендаций, предоставленных или одобренных TradingView. Подробнее читайте в Условиях использования.