PROTECTED SOURCE SCRIPT
Relative Strength of Stocks - Moti Rakam

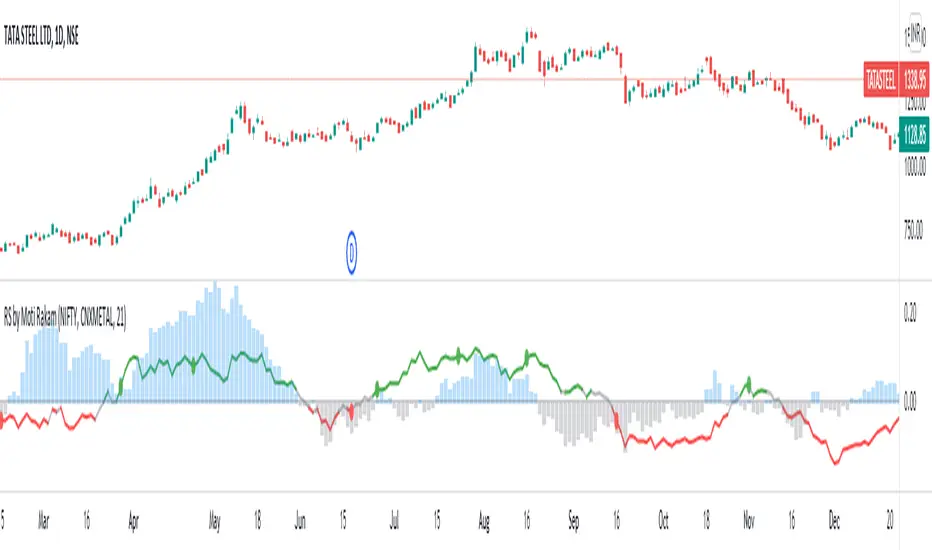
The indicator plots "Relative Strength" (RS) of a stock, in 2 ways:
1. Relative Strength of the sector index, against the wider market index. For example, in Indian market relative strength of any sector index like CNXAUTO or CNXMETAL, against NIFTY. RS of sector index against wider market index is plotted in "Columns". Blue color of Columns above zero line signifies that "Sector Index is outperforming the Wider Market Index". Gray color Columns under zero line signifies that "Sector Index is underperforming the Wider Market Index".
2. Relative Strength of the stock against it's sector index. For example, in Indian market, RS of TATA STEEL against CNXMETAL. The Stock RS is plotted with a line. Green color of RS line above 0.02 signifies that "Stock is outperforming it's sector index". Red color of RS line below -0.02 signifies that "Stock is underperforming it's sector index". Gray color of RS line between 0.02 and -0.02 represents neutral zone.
IMPORTANT: Right method to ascertain RS of a stock would be to look for the zones where 2 RS (sector RS and stock RS) are in consensus/confluence. For example, RS line of TATA STEEL is in green color and at the same time the CNXMETAL is also in Blue columns against NIFTY.
Скрипт с защищённым кодом
Этот скрипт опубликован с закрытым исходным кодом. Однако вы можете использовать его свободно и без каких-либо ограничений — читайте подробнее здесь.
@MotiRakam
Отказ от ответственности
Информация и публикации не предназначены для предоставления и не являются финансовыми, инвестиционными, торговыми или другими видами советов или рекомендаций, предоставленных или одобренных TradingView. Подробнее читайте в Условиях использования.