OPEN-SOURCE SCRIPT
Обновлено WaveTrend [LazyBear] vX by DGT

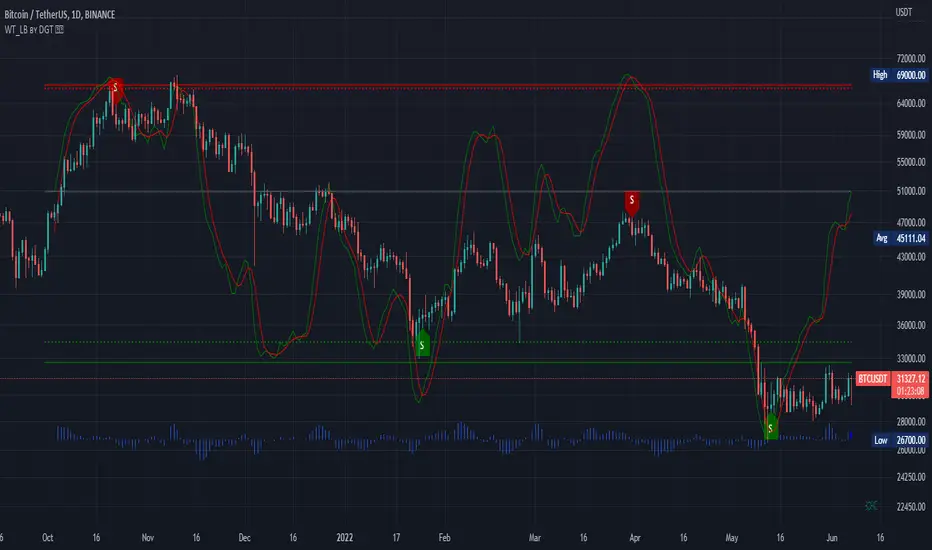
DGT interpreted version of LazyBear's WaveTrend, visualizing on Price Chart
Original Author : LazyBear
Crosses above or below threshold are emphasized with bigger labels
- crosses above threshold : probable short indications with a bigger label and relativly small label for probable long indications
- crosses below threshold : probable long indications with a bigger label and relativly small label for probable short indications
All rest crosses within threshold boundaries with relatively small labels for both long and short probable indications
Информация о релизе
small update : alert condition addedИнформация о релизе
update thanks to sandyrindal suggestions, special thanks to himadded ability to change the signal length
added ability to compare with other symbols, can be symbols that are directly correlated or inversely correlated symbols
Here is the modified code for the ones who enjoy the WaveTrend Oscillator on separate pane
//@version=4
//@author LazyBear, modified by dgtrd
study(title="WaveTrend [LazyBear]", shorttitle="WT_LB vX ʙʏ DGT ☼☾")
n1 = input(10, "Length : Channel ", inline = "LEN")
n2 = input(21, "Average", inline = "LEN")
s1 = input(4 , "Signal Length")
obLevel1 = input( 60, "Over Bought Level 1", inline = "OB")
obLevel2 = input( 53, "Level 2" , inline = "OB")
osLevel1 = input(-60, "Over Sold Level 1" , inline = "OS")
osLevel2 = input(-53, "Level 2" , inline = "OS")
f_getWT(s) =>
ap = s
esa = ema(ap, n1)
d = ema(abs(ap - esa), n1)
ci = (ap - esa) / (0.015 * d)
tci = ema(ci, n2)
wt1 = tci
wt2 = sma(wt1, s1)
[wt1, wt2]
plot(0 , color=color.gray )
plot(obLevel1, color=color.red )
plot(osLevel1, color=color.green)
plot(obLevel2, color=color.red , style=3)
plot(osLevel2, color=color.green, style=3)
[wt1, wt2] = f_getWT(hlc3)
plot(wt1 , color=color.green)
plot(wt2 , color=color.red , style=3)
plot(wt1-wt2, color=color.blue , style=plot.style_area, transp=80)
compare = input(false, "Compare with Symbol", inline = "CPR")
symbol = input("CBOE:VIX" , "", type=input.symbol, inline = "CPR")
extSrc = security (symbol , timeframe.period, hlc3, barmerge.gaps_off, barmerge.lookahead_on)
[wt1x, wt2x] = f_getWT(extSrc)
plot(compare ? wt1x : na, color=color.aqua)
plot(compare ? wt2x : na, color=color.yellow, style=3)
plot(compare ? wt1x-wt2x : na, color=color.olive, style=plot.style_area, transp=80)
Информация о релизе
added a label to display current values of the wavetrend and signal level Информация о релизе
Update* overlay wavetrand display addition, better interpretation
* enhanced signal customizations
Similar Indicators
Oscillators Overlay w/ Divergencies/Alerts : Oscillators-Overlay-with-Divergencies-Alerts
Elliott Wave Oscillator Signals : EWO-Signals
Скрипт с открытым кодом
В истинном духе TradingView, создатель этого скрипта сделал его открытым исходным кодом, чтобы трейдеры могли проверить и убедиться в его функциональности. Браво автору! Вы можете использовать его бесплатно, но помните, что перепубликация кода подчиняется нашим Правилам поведения.
Premium Indicators – Try Free for 15 Days: sites.google.com/view/solemare-analytics
Отказ от ответственности
Информация и публикации не предназначены для предоставления и не являются финансовыми, инвестиционными, торговыми или другими видами советов или рекомендаций, предоставленных или одобренных TradingView. Подробнее читайте в Условиях использования.