RSI Master Suite [Kodexius]
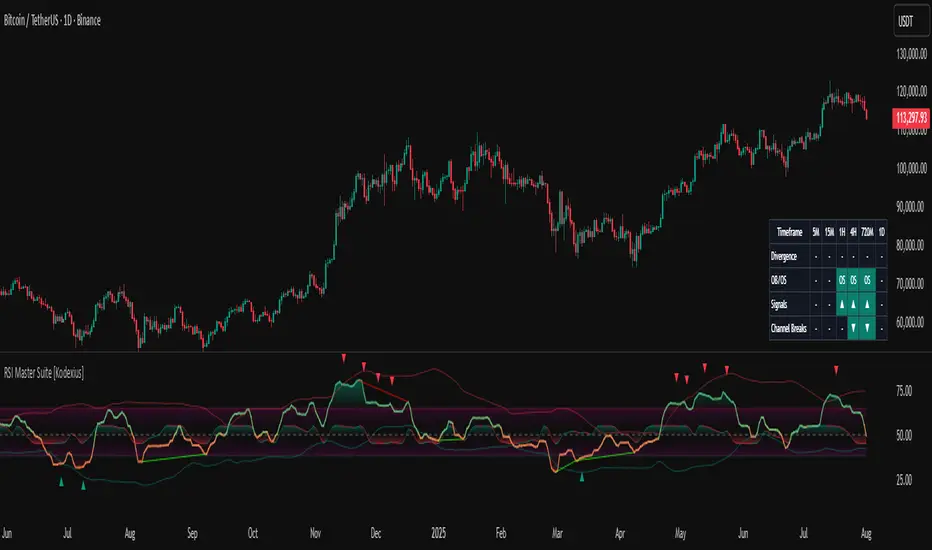
Instead of watching a single line cross fixed levels, you get dynamic channels, gradient zones, reversal markers, divergence mapping, multi timeframe readings, a compressed stochastic flow and automated RSI based trendlines. The goal is to let you read the state of momentum at a glance: where it is stretched, where it is reverting, how different timeframes align and where conditions may support a potential shift in direction.
This is not ordinary RSI. It is a complete momentum intelligence engine that is designed to help you identify trend strength, exhaustion, breakout style conditions and potential reversal points with a structured and visually guided approach.
⚠️ Note:
This suite builds on a custom RSI engine and enhances it with an MTF dashboard, dynamic channels, divergence and deviation logic, stochastic flow and smart alerting. It is suitable for traders who rely on price action and momentum context, from short term scalpers to swing traders and more systematic trend followers.
🔹 Features
🔸 Enhanced RSI Core
- Custom RSI style oscillator with optional adaptive smoothing that aims to reduce noise while keeping momentum turns visible in real time.
- Configurable source and oscillator length to adapt the tool to different markets, assets and styles.
- Optional RSI moving average for an extra layer of confirmation on crosses and reversals.
♦️ Adaptiveness Logic - Heart of the Oscillator
The adaptive RSI engine continuously measures how efficiently price has been moving over a recent window comparing net directional movement to the total back-and-forth volatility.
When price is trending cleanly, the engine behaves closer to a fast response, allowing the oscillator to track momentum shifts more aggressively. In choppy or noisy phases, it automatically slows down and applies a heavier smoothing profile, down-weighting random fluctuations while preserving the larger structural swings.
🔸 Dynamic Channel Suite
- Multiple channel modes (Bollinger-style, Keltner-style or Donchian-style) applied directly to RSI, giving a clear view of volatility and expansion/contraction phases in momentum.
- Upper and lower channel bands highlight when RSI is pressing into extreme territory or breaking out of its usual range.
- Channel touches and breaks can be used as an additional filter for exhaustion or continuation behavior.
🔸 Gradient Overbought/Oversold Zones
- Customizable OB/OS levels with gradient fills, making it easy to see when RSI is entering, residing in, or exiting critical zones.
- Smooth shading between overbought, oversold and midline areas provides instant visual context instead of relying on hard lines alone.
- Midline (50) is clearly marked, helping to distinguish between bullish and bearish momentum regimes.
🔸 Reversal Signal Markers
- Bullish and bearish reversal markers are plotted when RSI conditions suggest a potential shift after reaching OB/OS zones.
- Signals rely on interactions between Enhanced RSI and its internal smoothing, reducing noise compared to raw threshold crosses.
- Markers are placed directly on the RSI line for quick recognition without cluttering the price chart.
🔸 Divergence Mapping (Regular & Hidden)
- Detects regular bullish/bearish divergences as well as hidden bullish/bearish divergences between price and RSI.
- Optional “wait for candle close” behavior, giving you the choice between more reactive or more conservative confirmations.
- Separate visibility toggles for each divergence type so you can focus only on the signals that fit your approach.
🔸 Compressed Stochastic “Flow” Overlay
- Built-in adaptive and normalized Stochastic RSI layer, normalized into a compact band around the midline to avoid overcrowding the panel.
- The design focuses on direction and pressure rather than raw values: the flow band shows whether short-term momentum is actively feeding into the current RSI regime or fading against it, giving an immediate read on micro-structure underneath the main signal.
- Visual emphasis on whether the stochastic flow is leaning bullish or bearish, rather than on exact numeric values.
- Filled zones above/below the midline help to quickly gauge short-term momentum thrusts within the broader RSI context.
🔸 Multi-Timeframe (MTF) Dashboard
- Compact dashboard table that summarizes RSI conditions across multiple user-defined timeframes.
Per-timeframe cells show:
- Divergence bias (bullish/bearish/none),
- OB/OS state,
- Basic directional “signal” hints,
- RSI channel breaks (upside/downside).
Makes it easy to see alignment or conflict between intraday and higher-timeframe momentum without changing charts.
Timeframe labels auto-format into familiar units (e.g., 1H, 4H, 1D) for readability.
🔸 Oscillator-Based Trendlines & Break Detection
- Automatic drawing of oscillator trendlines derived from swing pivots on the oscillator, not just on price.
- Lines adapt to bullish or bearish structures, focusing on clean slopes with minimal internal violations.
- Breaks of these RSI trendlines are highlighted with labels, providing an additional structural confirmation of potential momentum shifts.
🔸 Alert-Ready Event Logic
- Integrated alert conditions for RSI-based reversals and all four divergence types (regular/hidden, bullish/bearish).
- Designed so you can create alerts directly from the indicator, turning key RSI events into actionable notifications.
Altogether, RSI Master Suite consolidates multiple momentum tools into one cohesive interface, helping you read the “story” of RSI and its derivatives more intuitively and efficiently.
🔹 How To Use
▶ Reading the Core Momentum Engine
- The main line represents the custom momentum engine: values sustained above the midline indicate a bullish-leaning regime, while values below it point to a more bearish-leaning backdrop. Gradient OB/OS zones make it easy to see where conditions are stretched or rotating out of extremes instead of behaving like simple on/off thresholds.
- The dynamic channel adds a second layer of structure:
• When the engine is pressing into or outside the outer channel, momentum is extended relative to its recent behaviour.
• When it oscillates closer to the mid-area of the channel, conditions are more neutral or mean-reverting.
- If the internal moving average is enabled, crosses between the engine and its average can highlight transitions between phases rather than just single-bar spikes, especially around overbought/oversold zones.
▶ Working With Reversals & Divergences
- Reversal markers appear when the engine has pushed into OB/OS regions and then begins to turn with confirmation from its internal smoothing. They are meant as attention points around potential inflection zones in momentum, not as blind entry or exit signals on their own.
- Divergence mapping compares the structure of price swings with the structure of the engine:
• Regular bullish/bearish divergences highlight potential exhaustion when price makes a new extreme but momentum does not confirm.
• Hidden bullish/bearish divergences highlight potential continuation when price pulls back but the engine remains relatively strong (or weak) underneath.
- You can choose which divergence types to display and whether they should only confirm on candle close. Keeping “wait for close” enabled generally provides a more conservative, less noisy view of divergence structure.
▶ Using the Compressed Stochastic “Flow” Overlay
- The Stochastic flow band is designed as a micro-structure layer on top of the main engine, compressed into a tight band around the midzone so it doesn’t require a separate oscillator panel.
- When the flow spends more time in the upper side of its band, short-term impulse is aligning with bullish pressure; when it leans to the lower side, short-term activity is skewed bearish. This makes it easier to judge whether recent pushes are driving with, or fading against, the current momentum regime.
- Filled areas above and below the central line turn this overlay into a quick visual gauge of short-term thrust inside the broader momentum context, especially when viewed together with reversals and divergences.
▶ Reading the Multi-Timeframe Dashboard
- The MTF dashboard compresses multiple timeframes into a small table so you can see cross-timeframe alignment without changing charts. Each column corresponds to one timeframe from your list, and each row represents a different aspect of the engine: divergence bias, OB/OS status, directional hint and channel break state.
- A practical approach is to:
• Scan for alignment, where several higher timeframes show similar momentum regimes or biases.
• Note areas of conflict, where lower timeframes are diverging or reverting while higher timeframes remain extended.
- Used this way, the dashboard acts as a context map you glance at before drilling into any individual setup.
▶ Trendlines, Breaks & Structure
- The oscillator-based trendlines are drawn from swing pivots on the engine itself. This can reveal underlying momentum structure that does not always appear clearly on raw price swings.
- Rising lines typically reflect underlying strength, while falling lines reflect underlying weakness. When these lines are broken and annotated on the panel, they can serve as structural confirmation that a prior momentum phase is weakening or transitioning into something new.
- Many users keep this component off for day-to-day monitoring and switch it on when they want a more detailed structural read on momentum phases.
Скрипт с ограниченным доступом
Доступ к этому скрипту имеют только пользователи, одобренные автором. Вам необходимо запросить и получить разрешение на его использование. Обычно оно предоставляется после оплаты. Для получения подробной информации следуйте инструкциям автора ниже или свяжитесь напрямую с Kodexius.
TradingView НЕ рекомендует оплачивать или использовать скрипт, если вы полностью не доверяете его автору и не понимаете, как он работает. Вы также можете найти бесплатные, открытые альтернативы в наших скриптах сообщества.
Инструкции от автора
Отказ от ответственности
Скрипт с ограниченным доступом
Доступ к этому скрипту имеют только пользователи, одобренные автором. Вам необходимо запросить и получить разрешение на его использование. Обычно оно предоставляется после оплаты. Для получения подробной информации следуйте инструкциям автора ниже или свяжитесь напрямую с Kodexius.
TradingView НЕ рекомендует оплачивать или использовать скрипт, если вы полностью не доверяете его автору и не понимаете, как он работает. Вы также можете найти бесплатные, открытые альтернативы в наших скриптах сообщества.