PROTECTED SOURCE SCRIPT
TRADE ORBIT:-Average Directional Index with Color Zones
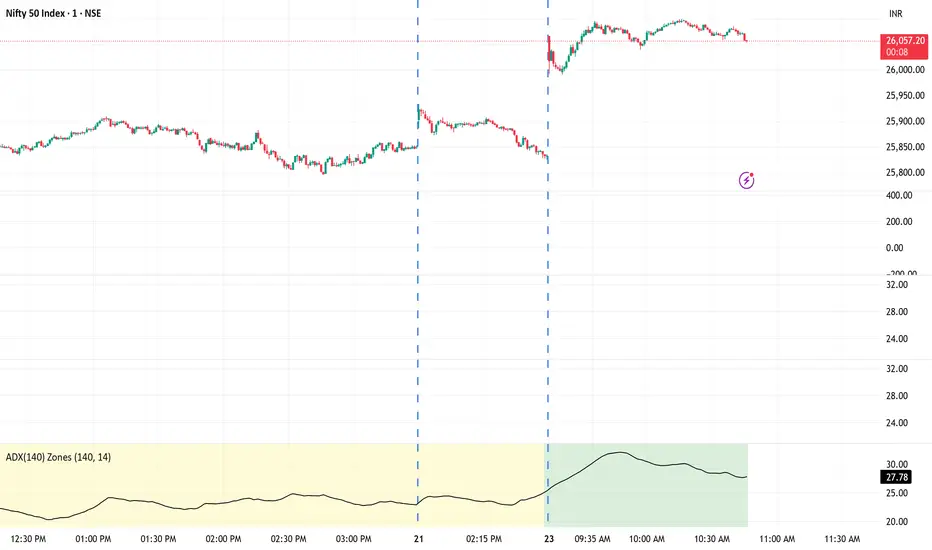
This indicator is a long-term smoothed version of the Average Directional Index (ADX) designed to measure trend strength while filtering out short-term noise.
It applies a 140-period smoothing to the ADX calculation, making it ideal for swing or positional traders who want to identify sustained trends rather than short-lived moves.
🎯 How It Works
The ADX(140) measures the strength of the current trend, regardless of direction.
The background color automatically changes based on the ADX value range to visually highlight the market condition.
ADX Range Background Color Interpretation
0–25 🟡 Yellow Weak trend / ranging market
25–50 🟢 Green Moderate trend strength
50–75 🔵 Blue Strong trend
75–100 🔴 Red Very strong / overheated trend
Horizontal reference lines are also plotted at 0, 25, 50, 75, and 100 to make the trend zones clear.
Скрипт с защищённым кодом
Этот скрипт опубликован с закрытым исходным кодом. Однако вы можете использовать его свободно и без каких-либо ограничений — читайте подробнее здесь.
Отказ от ответственности
Все виды контента, которые вы можете увидеть на TradingView, не являются финансовыми, инвестиционными, торговыми или любыми другими рекомендациями. Мы не предоставляем советы по покупке и продаже активов. Подробнее — в Условиях использования TradingView.