PROTECTED SOURCE SCRIPT
Aibuyzone Vector Strategy — Multi-Filter Momentum & Trend Align
Overview
The Aibuyzone Vector Strategy is a multi-filter system designed to identify strong directional momentum based on vector candle expansion, volume confirmation, and trend alignment across multiple timeframes.
This indicator combines classic volatility, volume, and momentum tools in a unified structure with a floating dashboard for clear visualization of market conditions.
Core Concept
The main idea behind the strategy is that large-bodied candles with range expansion and volume spikes often represent vector moves—periods when market participants push price aggressively in one direction.
The script quantifies this behavior by combining several filters:
Vector Candle Logic – Detects candles with strong body-to-range ratios (e.g., ≥ 60%) and range expansions relative to the Average True Range (ATR). Optional wick-imbalance filtering helps confirm directional pressure.
Volume Spike Filter – Confirms whether a candle’s volume exceeds its moving average (VolMA × Multiplier). This adds participation validation to prevent false momentum.
Trend Alignment – Uses dual EMA crossovers (fast vs. slow) on the current timeframe and optionally a higher-timeframe EMA filter to ensure trades align with prevailing market structure.
Momentum Confirmation (RSI) – Filters out overextended signals by requiring RSI to remain inside healthy momentum zones.
Fair Value Gap (FVG) Check – Optionally verifies the presence of a 3-bar FVG pattern in the same direction, adding a price-imbalance confluence.
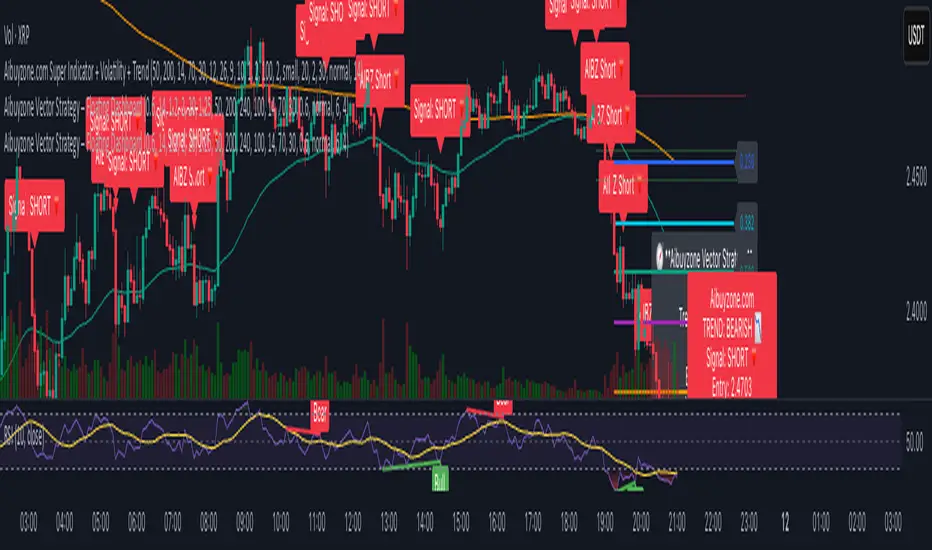
Floating Dashboard – Displays the current vector status, RSI, body percentage, and trend direction in real time near the latest price action for fast interpretation.
How It Works
Long Setup: Triggered when a bullish vector candle forms (strong body, volume expansion, range ≥ ATR × multiplier) in alignment with both LTF and HTF bullish trends, while RSI confirms momentum.
Short Setup: Triggered under the same logic but for bearish conditions.
Each signal can be visualized as a label (“AIBZ Long” 🚀 or “AIBZ Short” 🔻) and accompanied by an alert condition for automation.
The floating dashboard updates dynamically to reflect the market’s bias and key parameters on every new bar.
Interpretation & Use
This indicator is best applied for momentum and trend-continuation trading on intraday to swing timeframes.
Users may combine it with risk-management tools or support/resistance analysis to refine entries and exits.
It is not an automatic trading system but a visual and analytical framework that helps identify high-conviction vector movements.
Key Features
Customizable ATR, EMA, RSI, and Volume settings
Optional Higher-Timeframe trend validation
Dynamic floating dashboard
Optional Fair-Value-Gap confirmation
Built-in long/short alert conditions
Notes
This script is for educational and analytical purposes only. It does not provide financial advice or guaranteed results.
All parameters are user-adjustable to fit different assets and market conditions.
Recommended to use on clean charts without overlapping indicators for best readability.
The Aibuyzone Vector Strategy is a multi-filter system designed to identify strong directional momentum based on vector candle expansion, volume confirmation, and trend alignment across multiple timeframes.
This indicator combines classic volatility, volume, and momentum tools in a unified structure with a floating dashboard for clear visualization of market conditions.
Core Concept
The main idea behind the strategy is that large-bodied candles with range expansion and volume spikes often represent vector moves—periods when market participants push price aggressively in one direction.
The script quantifies this behavior by combining several filters:
Vector Candle Logic – Detects candles with strong body-to-range ratios (e.g., ≥ 60%) and range expansions relative to the Average True Range (ATR). Optional wick-imbalance filtering helps confirm directional pressure.
Volume Spike Filter – Confirms whether a candle’s volume exceeds its moving average (VolMA × Multiplier). This adds participation validation to prevent false momentum.
Trend Alignment – Uses dual EMA crossovers (fast vs. slow) on the current timeframe and optionally a higher-timeframe EMA filter to ensure trades align with prevailing market structure.
Momentum Confirmation (RSI) – Filters out overextended signals by requiring RSI to remain inside healthy momentum zones.
Fair Value Gap (FVG) Check – Optionally verifies the presence of a 3-bar FVG pattern in the same direction, adding a price-imbalance confluence.
Floating Dashboard – Displays the current vector status, RSI, body percentage, and trend direction in real time near the latest price action for fast interpretation.
How It Works
Long Setup: Triggered when a bullish vector candle forms (strong body, volume expansion, range ≥ ATR × multiplier) in alignment with both LTF and HTF bullish trends, while RSI confirms momentum.
Short Setup: Triggered under the same logic but for bearish conditions.
Each signal can be visualized as a label (“AIBZ Long” 🚀 or “AIBZ Short” 🔻) and accompanied by an alert condition for automation.
The floating dashboard updates dynamically to reflect the market’s bias and key parameters on every new bar.
Interpretation & Use
This indicator is best applied for momentum and trend-continuation trading on intraday to swing timeframes.
Users may combine it with risk-management tools or support/resistance analysis to refine entries and exits.
It is not an automatic trading system but a visual and analytical framework that helps identify high-conviction vector movements.
Key Features
Customizable ATR, EMA, RSI, and Volume settings
Optional Higher-Timeframe trend validation
Dynamic floating dashboard
Optional Fair-Value-Gap confirmation
Built-in long/short alert conditions
Notes
This script is for educational and analytical purposes only. It does not provide financial advice or guaranteed results.
All parameters are user-adjustable to fit different assets and market conditions.
Recommended to use on clean charts without overlapping indicators for best readability.
Скрипт с защищённым кодом
Этот скрипт опубликован с закрытым исходным кодом. Однако вы можете использовать его свободно и без каких-либо ограничений — читайте подробнее здесь.
Signup for our Indicators Aibuyzone.com
Отказ от ответственности
Все виды контента, которые вы можете увидеть на TradingView, не являются финансовыми, инвестиционными, торговыми или любыми другими рекомендациями. Мы не предоставляем советы по покупке и продаже активов. Подробнее — в Условиях использования TradingView.