OPEN-SOURCE SCRIPT
Extension from 20 Period Simple Moving Average
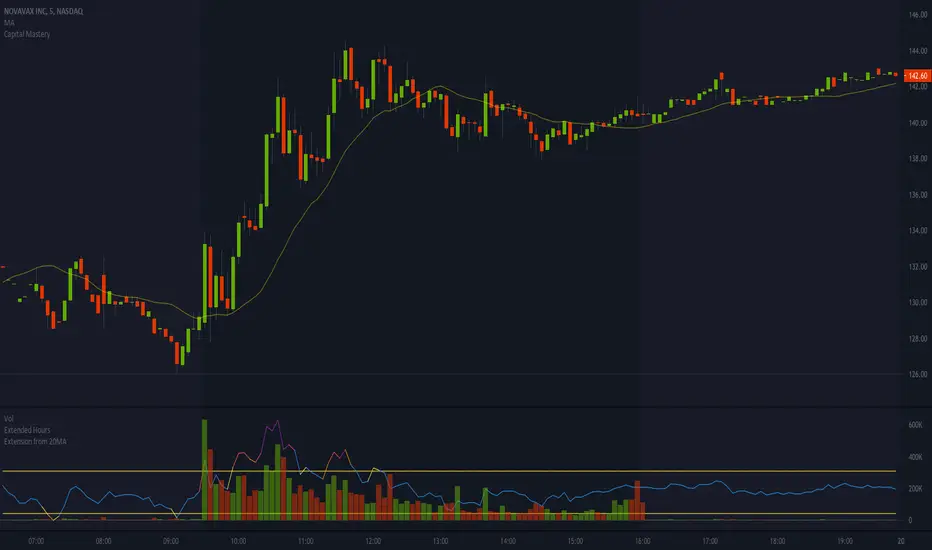
Simple indicator to help show when stocks are over extended intraday. It's based on the distance between a stock and it's moving average. The thesis being that, the farther away a stock is from it's 20 period simple moving average, the move extended it is. I've found that when a stock is more than 2-3% extended from it's 5min 20 period moving average, it's typically getting over extended, and can be a great time to start considering a short.
I primarily use this indicator when shorting intraday parabolic moves, while the stock is still on the frontside of the move. Note that this works best when the indicator is showing overextended AND there's a volume spike/mountain matching the overextension. In the attached example, you can see that I overlay this indicator on top of the volume panel because it helps me better visualize when the stock is getting over extended on heavy/elevated volume.
Hope this helps; any feedback is appreciated!
P.S. This works best on a 5min chart, but I'm sure it could be helpful on other timeframes, but may need to tweak the default outer bounds percentage.
Скрипт с открытым кодом
В истинном духе TradingView, создатель этого скрипта сделал его открытым исходным кодом, чтобы трейдеры могли проверить и убедиться в его функциональности. Браво автору! Вы можете использовать его бесплатно, но помните, что перепубликация кода подчиняется нашим Правилам поведения.
Отказ от ответственности
Информация и публикации не предназначены для предоставления и не являются финансовыми, инвестиционными, торговыми или другими видами советов или рекомендаций, предоставленных или одобренных TradingView. Подробнее читайте в Условиях использования.