|Magical Trend Line with RSI & ADX|
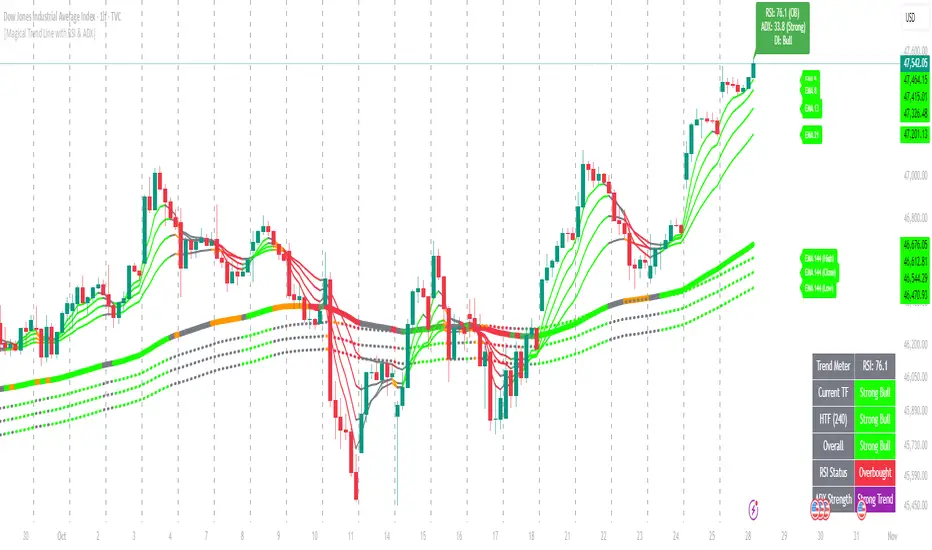
### Adaptive Multi-Layer Trend Analyzer with EMA Structure, RSI Momentum, ADX Strength & Table Dashboard
**Version:** 1.0 | **Language:** Pine Script v6 | **Author:** ask2maniish
---
## 🔍 Summary of the Script
This indicator combines **EMA trend structure**, **RSI**, and **ADX** to form a **multi-layered trend confirmation system** with rich visual cues and a live table dashboard.
---
## 🧭 1. Trend Direction System
Uses **EMA Fast**, **EMA Slow**, and **Main EMA (default 100-period)** to detect the current trend structure.
Classifies trends into 5 categories:
| Trend Type | Color | Description |
|-------------|--------|-------------|
| 🟢 Bright Green | Strong Bullish | Strong upside with momentum |
| 🟩 Green | Moderate Bullish | Controlled upward structure |
| ⚪ Gray | Sideways / Neutral | Low momentum or indecision |
| 🟧 Orange | Moderate Bearish | Controlled decline |
| 🔴 Red | Strong Bearish | Aggressive downward pressure |
---
## ⚙️ 2. RSI + ADX Momentum Filter
**RSI** detects momentum direction and exhaustion:
- RSI > 70 → Overbought (Potential reversal)
- RSI < 30 → Oversold (Potential reversal)
- RSI rising above 50 → Bullish momentum
- RSI falling below 50 → Bearish momentum
**ADX** identifies trend strength:
- ADX > 25 → Strong trend
- ADX < 25 → Weak / ranging market
✅ **Combined Logic:**
RSI defines direction, ADX confirms strength.
When both align with EMA structure, trend continuation probability increases.
---
## 📈 3. Multiple EMA Layers (7 Total)
Optionally visualize up to **7 EMAs (5, 8, 13, 21, 144-high, 144-close, 144-low)**.
Each EMA auto-colors using localized slope and RSI/ADX confluence logic.
Gives a clear view of **momentum stacking** and **trend maturity**.
---
## 📊 4. Trend Meter Table (HTF + LTF View)
A dynamic table provides both **current timeframe (LTF)** and **higher timeframe (HTF)** trend confirmation.
| Table Section | Description |
|----------------|-------------|
| **Current TF Trend** | EMA-based directional bias |
| **HTF Trend** | Optional higher timeframe confirmation |
| **RSI Status** | Momentum context |
| **ADX Strength** | Trend power |
| **Overall Bias** | Combined directional strength |
🧩 Example:
- ✅ Both LTF & HTF show Bullish → focus on longs.
- ❌ Both Bearish → focus on shorts.
- ⚪ Mixed → stand aside or scalp.
---
## 🎨 5. Background & Label System
- **Soft background shading** → shows live market bias.
- **On-chart labels** → display EMA trend, RSI/ADX values, and crossover events.
- **Color-coded EMA bands** → provide instant visual context.
---
## 🎯 How to Trade Using This Indicator
### 1️⃣ Identify Overall Market Context
Use the **Trend Meter Table** for directional bias.
- ✅ Bullish on both TFs → Focus on long setups.
- ❌ Bearish on both TFs → Focus on short setups.
- ⚪ Mixed signals → Wait for clarity or scalp only.
---
### 2️⃣ Entry Logic
**Long Setup**
- Main EMA color = 🟢 Green or Bright Green
- RSI rising above 50 (not yet overbought)
- ADX > threshold (e.g., 25)
- Price above both Fast & Slow EMA
**Short Setup**
- Main EMA color = 🟧 Orange or 🔴 Red
- RSI below 50 (not yet oversold)
- ADX > threshold
- Price below both Fast & Slow EMA
---
### 3️⃣ Exit / Reversal
- RSI enters overbought/oversold zone → take profit or tighten stop.
- Trend label shifts from “Strong” to “Moderate” → trend weakening.
- Candle closes below/above EMA cluster → exit signal.
---
### 4️⃣ Multi-Timeframe Confirmation
Always trade in the direction of **HTF bias**.
Example:
📍 On 15m → Confirm with 4H trend.
If 4H = “Strong Bullish”, only take long entries when local (15m) = bullish.
---
## ⚡ Tips
- Use with Smart Money Concepts or liquidity tools for added confluence.
- Works well for swing, intraday, and positional setups.
- Adjust RSI/ADX thresholds to match volatility regime.
---
## 📘 Disclaimer
This indicator is for **educational purposes** only and does not constitute financial advice.
Trade responsibly and use risk management at all times.
---
**© 2025 ask2maniish | Magical Trend Line with RSI & ADX**
Скрипт с ограниченным доступом
Только пользователи, одобренные автором, могут получить доступ к этому скрипту. Вам нужно отправить запрос и получить разрешение на его использование. Обычно доступ предоставляется после оплаты. Для получения подробной информации следуйте инструкциям автора ниже или свяжитесь с ask2maniish напрямую.
TradingView НЕ рекомендует платить за скрипт или использовать его, если вы не доверяете его автору и не понимаете, как скрипт работает. Вы всегда можете найти бесплатные скрипты с открытым исходным кодом в Скриптах сообщества.
Инструкции от автора
Отказ от ответственности
Скрипт с ограниченным доступом
Только пользователи, одобренные автором, могут получить доступ к этому скрипту. Вам нужно отправить запрос и получить разрешение на его использование. Обычно доступ предоставляется после оплаты. Для получения подробной информации следуйте инструкциям автора ниже или свяжитесь с ask2maniish напрямую.
TradingView НЕ рекомендует платить за скрипт или использовать его, если вы не доверяете его автору и не понимаете, как скрипт работает. Вы всегда можете найти бесплатные скрипты с открытым исходным кодом в Скриптах сообщества.