OPEN-SOURCE SCRIPT
Обновлено X.Y Format Candle Volume & Compression
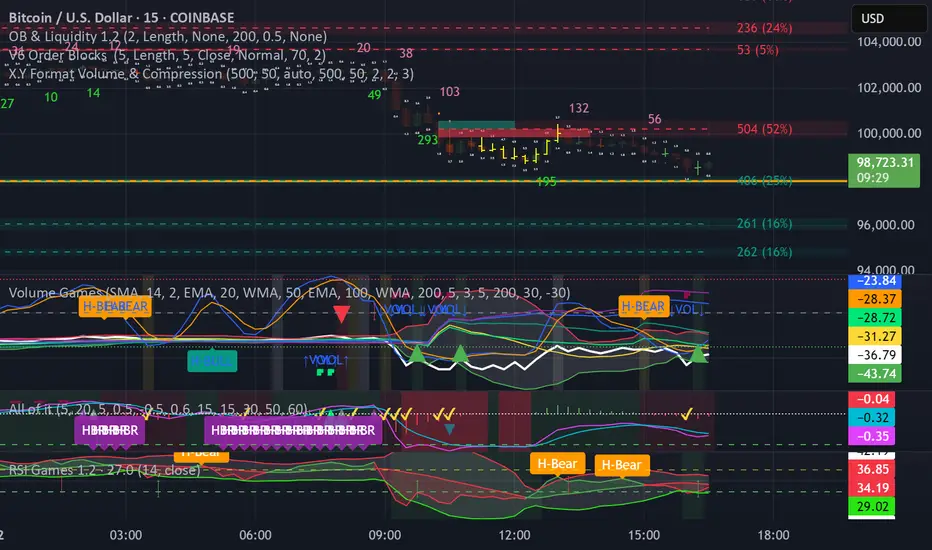
The Volume & Compression Indicator is designed to help traders identify significant market moves by displaying two key metrics above each candle. The top number represents the Volume Ratio, which compares the current candle's volume to the average volume of recent candles. For example, a reading of 2.5 means the current volume is 2.5 times higher than average. When volume exceeds 9.9 times the average, the indicator displays an up or down arrow instead of a number, indicating extremely high volume in that direction.
The bottom number shows the Compression Ratio, which measures the relationship between volume and price movement. This helps identify when large amounts of volume are moving price significantly (low compression) versus when high volume isn't resulting in much price movement (high compression). High compression often indicates accumulation or distribution phases, while low compression with high volume typically suggests strong directional moves.
The indicator includes visual cues to help spot patterns. Dots appear above candles when both high volume and high compression persist over several candles, potentially indicating accumulation phases. Arrows mark possible pivot points after these accumulation periods. Additionally, the candles themselves can display a gradient color that intensifies with increased compression, making it easier to spot areas of interest.
For trading purposes, watch for volume spikes (top number above 2.0) as they can signal potential reversal points or confirm breakouts. High compression readings might precede breakouts, while low compression with high volume often confirms strong trend moves. The most significant signals often come when both metrics show high readings over multiple candles, suggesting sustained institutional interest.
Информация о релизе
This updated version corrects some issues with spacing and calculations.It also allows to disable trim for both volume and compression as well as select auto for the font size.
Скрипт с открытым кодом
В истинном духе TradingView, создатель этого скрипта сделал его открытым исходным кодом, чтобы трейдеры могли проверить и убедиться в его функциональности. Браво автору! Вы можете использовать его бесплатно, но помните, что перепубликация кода подчиняется нашим Правилам поведения.
Отказ от ответственности
Информация и публикации не предназначены для предоставления и не являются финансовыми, инвестиционными, торговыми или другими видами советов или рекомендаций, предоставленных или одобренных TradingView. Подробнее читайте в Условиях использования.