MVolume‴ | Multi Volume Indicator‴
This simple but yet efficient indicator view presents the Volume with the following benefits:
1. both buyer and seller volume are shown separately and above zero line, this way its possible to see which side is dominant;
2. both buyer and seller volume are shown separately, with buyers above the zero line and sellers bellow the zero line. The dominant side is shown in its darker color version;
3. 20 period Moving Average line is calculated separately and plotted for each side (buyer/seller);
4. 50% of the 20 period Moving Average line is calculated separately and plotted for each side (buyer/seller);
5. possibility to apply Directional OHLC values to enhance the buyer/seller movement interpretation.
p.s.: the chart presents two MVol indicators to let you see the different possible views.
To request access to this invite-only script, please DM me.
- runs on Pine 4
- size arrow for buyer (blue) and seller (red) bar slice: show you if the current slices are greater or not if compared to the previous bar slices
- provides buyer and seller slice percentage and average number of trades
This is a game changing for your analysis!
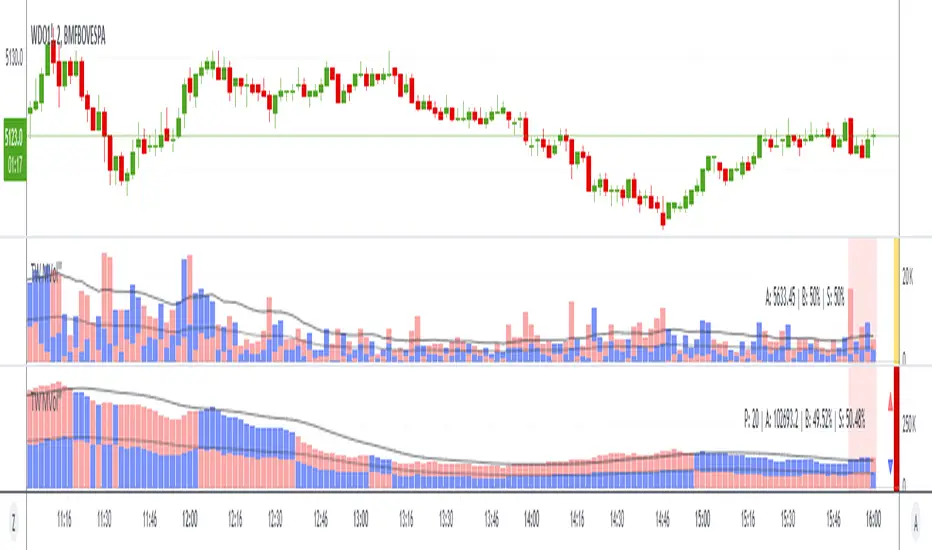
Look at the image, the:
1. top MVol: is the regular volume you are already familiar, where the buy and sell partitions of each volume bar are shown separately;
2. bottom MVol: is the 5 period Accumulated Volume. Notice how the buy blue bars takes controle during a certain period of time and than the sell red bars take over during the next time period of time.
Hope you like it!
1. now the volume can be ploted with an accumulated format;
2. it's possible to choose the desired period to present accumulated volume. The pre-defined period values are: 6, 20, 72, 100, 200;
3. there's a field to enter your prefered accumulated volume period.
Скрипт с ограниченным доступом
Доступ к этому скрипту имеют только пользователи, одобренные автором. Вам необходимо запросить и получить разрешение на его использование. Обычно оно предоставляется после оплаты. Для получения подробной информации следуйте инструкциям автора ниже или свяжитесь напрямую с MarceloTorres.
TradingView НЕ рекомендует оплачивать или использовать скрипт, если вы полностью не доверяете его автору и не понимаете, как он работает. Вы также можете найти бесплатные, открытые альтернативы в наших скриптах сообщества.
Инструкции от автора
marcelo@tradewiser.pro
Vídeo-Análise completa diária no YouTube:
youtube.com/c/TradeWiserPro
Curso/AE
CursoAE.TradeWiser.pro
@TradeWiserPro
Telegram, Twitter, Facebook, LinkedIn, Instagram
Отказ от ответственности
Скрипт с ограниченным доступом
Доступ к этому скрипту имеют только пользователи, одобренные автором. Вам необходимо запросить и получить разрешение на его использование. Обычно оно предоставляется после оплаты. Для получения подробной информации следуйте инструкциям автора ниже или свяжитесь напрямую с MarceloTorres.
TradingView НЕ рекомендует оплачивать или использовать скрипт, если вы полностью не доверяете его автору и не понимаете, как он работает. Вы также можете найти бесплатные, открытые альтернативы в наших скриптах сообщества.
Инструкции от автора
marcelo@tradewiser.pro
Vídeo-Análise completa diária no YouTube:
youtube.com/c/TradeWiserPro
Curso/AE
CursoAE.TradeWiser.pro
@TradeWiserPro
Telegram, Twitter, Facebook, LinkedIn, Instagram