OPEN-SOURCE SCRIPT
Обновлено PDMA + MA_Dist (%diff of 2 MA's + MA price distance)
The PDMA + MA_Dist indicator is a powerful tool designed to analyze the relationship between two customizable moving averages (MAs) and the distance of a slow moving average from the price. It provides valuable insights into market trends and potential buying or selling opportunities.
This indicator calculates the percentage difference between the closing price and the fast moving average (MA). It also calculates the percentage difference between the closing price and the slow MA. Additionally, it calculates the percentage difference between the fast MA and the slow MA. These three metrics are then combined to form the final value of the indicator.
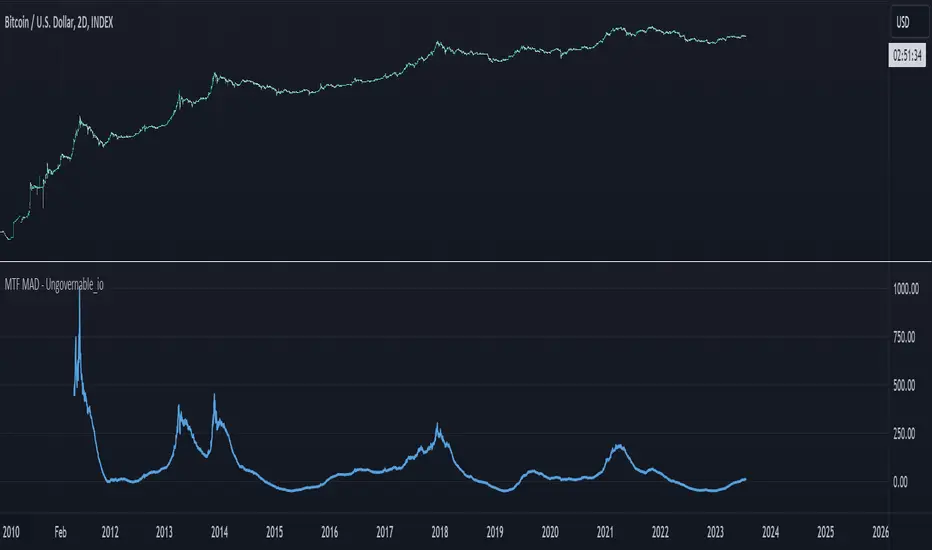
By plotting the PDMA + MA_Dist indicator on a chart, users can visualize the dynamics between the MAs and the price. The indicator helps identify periods of bullish or bearish sentiment in the market based on the position of the closing price relative to the MAs. It also highlights potential buying or selling signals when the final value crosses predefined buy or sell levels.
The PDMA + MA_Dist indicator offers a comprehensive perspective on market trends and price movements, assisting traders and investors in making informed decisions.
This indicator calculates the percentage difference between the closing price and the fast moving average (MA). It also calculates the percentage difference between the closing price and the slow MA. Additionally, it calculates the percentage difference between the fast MA and the slow MA. These three metrics are then combined to form the final value of the indicator.
By plotting the PDMA + MA_Dist indicator on a chart, users can visualize the dynamics between the MAs and the price. The indicator helps identify periods of bullish or bearish sentiment in the market based on the position of the closing price relative to the MAs. It also highlights potential buying or selling signals when the final value crosses predefined buy or sell levels.
The PDMA + MA_Dist indicator offers a comprehensive perspective on market trends and price movements, assisting traders and investors in making informed decisions.
Информация о релизе
Updated to allow switch between SMA & EMAИнформация о релизе
Updated interfaces, titles, & TF customization for each MA.Информация о релизе
Added ability to just plot the final value (MA to MA distance + MA_Dist, MA to MA distance, and MA to Price distance)Информация о релизе
Added functionality: choose between, Slow, Fast, or Both MA's to calculate the MA_Dist and Final Value.Информация о релизе
The original code calculates an indicator based on two key factors: the difference between the price and the Moving Average (MA), and the difference between a fast and slow MA. The final value provided by this code is a combination of these two measurements.The new code introduces a weight parameter which allows you to control the balance between these two measurements. This weight can range from -1 to 1:
When the weight is -1, the final value only considers the difference between the price and the MA, disregarding the difference between the fast and slow MAs.
When the weight is 1, the final value only takes into account the difference between the fast and slow MAs, ignoring the difference between the price and the MA.
When the weight is 0, the final value is a balanced average of both measures, behaving just like the original code.
Importantly, the weight doesn't have to be just -1, 0, or 1. Any value in between is valid, allowing for a gradual bias towards one measure or the other. For example, a weight of 0.3 would calculate a final value that leans towards the difference between fast and slow MAs, but still considers the difference between the price and the MA. This provides more flexibility for fine-tuning the balance based on your analysis needs.
Скрипт с открытым кодом
В истинном духе TradingView, создатель этого скрипта сделал его открытым исходным кодом, чтобы трейдеры могли проверить и убедиться в его функциональности. Браво автору! Вы можете использовать его бесплатно, но помните, что перепубликация кода подчиняется нашим Правилам поведения.
Отказ от ответственности
Информация и публикации не предназначены для предоставления и не являются финансовыми, инвестиционными, торговыми или другими видами советов или рекомендаций, предоставленных или одобренных TradingView. Подробнее читайте в Условиях использования.