PROTECTED SOURCE SCRIPT
🔵Blue Mark
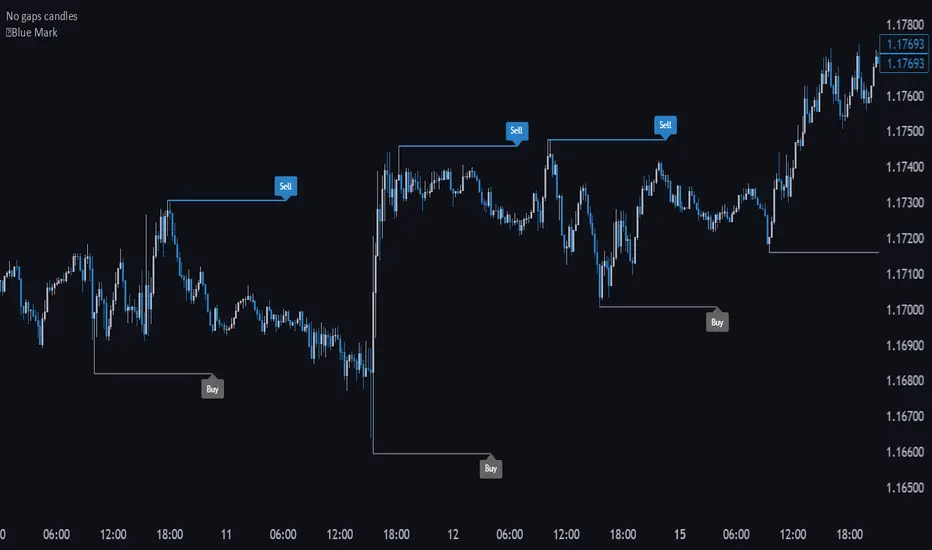
📌 Blue Mark – TradingView Indicator
The Blue Mark indicator highlights extreme price points across multiple timeframes (15m, 5m, 1m), helping intraday traders identify liquidity zones and areas of institutional interest. It is designed for traders who want to spot high-probability entry and exit points based on market structure and volume concentration.
✔️ Marks extreme highs and lows on 15m, 5m, and 1m charts
✔️ Ideal for intraday trading and short-term strategies
✔️ Helps detect liquidity zones where institutional orders are likely concentrated
✔️ Supports tactical entries and exits aligned with market structure
How to use:
Apply the indicator to your chart.
Observe the marked extreme points on different timeframes.
Use these levels to plan entries, exits, or confirm areas of institutional interest.
Скрипт с защищённым кодом
Этот скрипт опубликован с закрытым исходным кодом. Однако вы можете использовать его свободно и без каких-либо ограничений — читайте подробнее здесь.
Отказ от ответственности
Информация и публикации не предназначены для предоставления и не являются финансовыми, инвестиционными, торговыми или другими видами советов или рекомендаций, предоставленных или одобренных TradingView. Подробнее читайте в Условиях использования.