OPEN-SOURCE SCRIPT
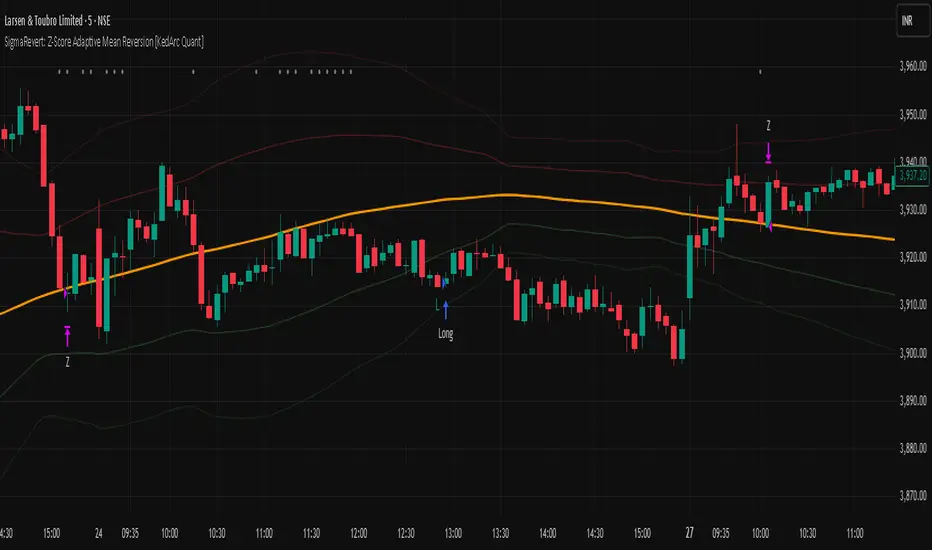
SigmaRevert: Z-Score Adaptive Mean Reversion [KedArc Quant]
🔍 Overview
SigmaRevert is a clean, research-driven mean-reversion framework built on Z-Score deviation — a statistical measure of how far the current price diverges from its dynamic mean.
When price stretches too far from equilibrium (the mean), SigmaRevert identifies the statistical “sigma distance” and seeks reversion trades back toward it. Designed primarily for 5-minute intraday use, SigmaRevert automatically adapts to volatility via ATR-based scaling, optional higher-timeframe trend filters, and cooldown logic for controlled frequency
🧠 What “Sigma” Means Here
In statistics, σ (sigma) represents standard deviation, the measure of dispersion or variability.
SigmaRevert uses this concept directly:
Each bar’s price deviation from the mean is expressed as a Z-Score — the number of sigmas away from the mean.
When Z > 1.5, the price is statistically “over-extended”; when it returns toward 0, it reverts to the mean.
In short:
Sigma = Standard deviation distance
SigmaRevert = Trading the reversion of extreme sigma deviations
💡 Why Traders Use SigmaRevert
Quant-based clarity: removes emotion by relying on statistical extremes.
Volatility-adaptive: automatically adjusts to changing market noise.
Low drawdown: filters avoid over-exposure during strong trends.
Multi-market ready: works across stocks, indices, and crypto with parameter tuning.
Modular design: every component can be toggled without breaking the core logic.
🧩 Why This Is NOT a Mash-Up
Unlike “mash-up” scripts that randomly combine indicators, this strategy is built around one cohesive hypothesis:
“Price deviations from a statistically stable mean (Z-Score) tend to revert.”
Every module — ATR scaling, cooldown, HTF trend gating, exits — reinforces that single hypothesis rather than mixing unrelated systems (like RSI + MACD + EMA).
The structure is minimal yet expandable, maintaining research integrity and transparency.
⚙️ Input Configuration (Simplified Table)
Core
`maLen` 120 Lookback for mean (SMA)
`zLen` 60 Window for Z-score deviation
`zEntry` 1.5 Entry when Z exceeds threshold
`zExit` 0.3 Exit when Z normalizes
Filters (optional)
`useReCross` false Requires re-entry confirmation
`useTrend` false / true Enables HTF SMA bias
`htfTF` “60” HTF timeframe (e.g. 60-min)
`useATRDist` false Demands min distance from mean
`atrK` 1.0 ATR distance multiplier
`useCooldown` false / true Forces rest after exit
Risk
`useATRSL` false / true Adaptive stop-loss via ATR
`atrLen` 14 ATR lookback
`atrX` 1.4 ATR multiplier for stop
Session
`useSession` false Restrict to market hours
`sess` “0915-1530” NSE timing
`skipOpenBars` 0–3 Avoid early volatility
UI
`showBands` true Displays ±1σ & ±2σ
`showMarks` true Shows triggers and exits
🎯 Entry & Exit Logic
Long Entry
Trigger: `Z < -zEntry`
Optional re-cross: prior Z < −zEntry, current Z −zEntry
Optional trend bias: current close above HTF SMA
Optional ATR filter: distance from mean ATR × K
Short Entry
Trigger: `Z +zEntry`
Optional re-cross: prior Z +zEntry, current Z < +zEntry
Optional trend bias: current close below HTF SMA
Optional ATR filter: distance from mean ATR × K
Exit Conditions
Primary exit: `Z < zExit` (price normalized)
Time stop: `bars since entry timeStop`
Optional ATR stop-loss: ±ATR × multiplier
Optional cooldown: no new trade for X bars after exit
🕒 When to Use
Intraday (5m)
`maLen=120`, `zEntry=1.5`, `zExit=0.3`, `useTrend=false`, `cooldownBars=6` Capture intraday oscillations Minutes → hours
Swing (30m–1H)
`maLen=200`, `zEntry=1.8`, `zExit=0.4`, `useTrend=true`, `htfTF="D"` Mean-reversion between daily pivots 1–2 days
Positional (4H–1D)
`maLen=300`, `zEntry=2.0`, `zExit=0.5`, `useTrend=true` Capture multi-day mean reversions Days → weeks
📘 Glossary
Z-Score
Statistical measure of how far current price deviates from its mean, normalized by standard deviation.
Mean Reversion
The tendency of price to return to its average after temporary divergence.
ATR
Average True Range — measures volatility and defines adaptive stop distances.
Re-Cross
Secondary signal confirming reversal after an extreme.
HTF
Higher Timeframe — provides macro trend bias (e.g. 1-hour or daily).
Cooldown
Minimum bars to wait before re-entering after a trade closes.
❓ FAQ
Q1: Why are there no trades sometimes?
➡ Check that all filters are off. If still no trades, Z-scores might not breach the thresholds. Lower `zEntry` (1.2–1.4) to increase frequency.
Q2: Why does it sometimes fade breakouts?
➡ Mean reversion assumes overextension — disable it during strong trending days or use the HTF filter.
Q3: Can I use this for Forex or Crypto?
➡ Yes — but adjust session filters (`useSession=false`) and increase `maLen` for smoother means.
Q4: Why is profit factor so high but small overall gain?
➡ Because this script focuses on capital efficiency — low drawdown and steady scaling. Increase position size once stable.
Q5: Can I automate this on broker integration?
➡ Yes — the strategy uses standard `strategy.entry` and `strategy.exit` calls, compatible with TradingView webhooks.
🧭 How It Helps Traders
This strategy gives:
Discipline: no impulsive trades — strict statistical rules.
Consistency: removes emotional bias; same logic applies every bar.
Scalability: works across instruments and timeframes.
Transparency: all signals are derived from visible Z-Score math.
It’s ideal for quant-inclined discretionary traders who want rule-based entries but maintain human judgment for context (earnings days, macro news, etc.).
🧱 Final Notes
Best used on liquid stocks with continuous price movement.
Avoid illiquid or gap-heavy tickers.
Validate parameters per instrument — Z behavior differs between equities and indices.
Remember: Mean reversion works best in range-bound volatility, not during explosive breakouts.
⚠️ Disclaimer
This script is provided for educational purposes only.
Past performance does not guarantee future results.
Trading involves risk, and users should exercise caution and use proper risk management when applying this strategy.
Скрипт с открытым кодом
В истинном духе TradingView автор этого скрипта опубликовал его с открытым исходным кодом, чтобы трейдеры могли понять, как он работает, и проверить на практике. Вы можете воспользоваться им бесплатно, но повторное использование этого кода в публикации регулируется Правилами поведения.
Отказ от ответственности
Все виды контента, которые вы можете увидеть на TradingView, не являются финансовыми, инвестиционными, торговыми или любыми другими рекомендациями. Мы не предоставляем советы по покупке и продаже активов. Подробнее — в Условиях использования TradingView.