PROTECTED SOURCE SCRIPT
VWAP Spaghetti
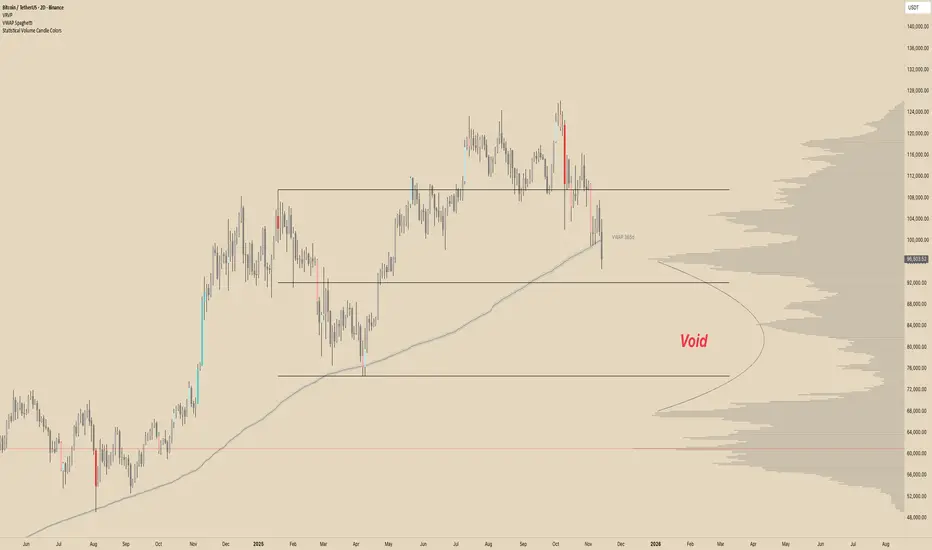
VWAP Spaghetti is a multi-timeframe VWAP overlay designed to show where price is trading relative to its volume-weighted “fair value” across several horizons at once.
The script plots up to five separate VWAPs (default: 30, 60, 90, 180, and 365) directly on your chart, each with its own color, bands, and labels. You can use it to see short, medium, and long-term VWAP structure in one view and quickly spot areas of support/resistance, mean-reversion zones, and where price is trading at a premium or discount.
⸻
Core Idea
• VWAP (Volume-Weighted Average Price) shows the average price paid, weighted by volume.
• This script stacks multiple rolling VWAPs together (your “spaghetti”) so you can see how price interacts with different time horizons instead of just one.
⸻
Two Modes: Candles vs. Days
• Candles mode
• Each VWAP is calculated over the last N candles on your current timeframe.
• Example: On a 1h chart with period = 30, you’re seeing a 30-candle VWAP (30hours).
• Days mode
• Treats the input as N days and automatically chooses higher timeframes (60/120/240/360 min or Daily) to keep the lines smooth and extend history.
• Great for things like “30-day VWAP” or “365-day VWAP” regardless of your chart timeframe.
• In this mode, labels add a “d” suffix (e.g., VWAP 30d).
You can switch between these with the “Timeframe Type” setting: Candles or Days.
⸻
What Each VWAP Line Includes
For each of the 5 VWAPs you can independently control:
• Period
• Default examples: 30 / 60 / 90 / 180 / 365 (candles or days, depending on mode).
• Style & Visibility
• Line color and width.
• Toggle on/off for each VWAP.
• Labels
• Optional label on the far right of the chart showing the period (e.g., VWAP 60 or VWAP 60d).
• Adjustable label size and horizontal offset.
• Percent Deviation Cloud
• Upper and lower bands at +/- X% from the VWAP (default 0.4%).
• Fills a soft “cloud” around the VWAP to visualize premium/discount zones.
• Standard Deviation Bands (optional)
• Toggle standard deviation bands on/off for each VWAP.
• Uses a volume-weighted standard deviation and a configurable multiplier (e.g., 1.0, 1.5, 2.0).
• Plots an additional cloud around the VWAP based on volatility instead of a fixed percentage.
⸻
How Traders Might Use It
• Mean reversion:
Look for price stretching far outside a VWAP cloud and snapping back toward it.
• Trend structure:
Multiple VWAPs stacked and sloping in the same direction can help visualize trend strength across different horizons.
• Dynamic support/resistance:
VWAP lines and their bands often act as reaction levels where price consolidates or reverses.
• Multi-horizon context:
See short-term and long-term “fair value” at the same time (e.g., intraday vs. 30-day vs. 365-day VWAP).
This script is meant to be visual, flexible, and simple to use: turn on the VWAPs you care about, choose Candles or Days mode, and let the “spaghetti” show you where price sits relative to volume-weighted value across time.
Скрипт с защищённым кодом
Этот скрипт опубликован с закрытым исходным кодом. Однако вы можете использовать его свободно и без каких-либо ограничений — читайте подробнее здесь.
Отказ от ответственности
Информация и публикации не предназначены для предоставления и не являются финансовыми, инвестиционными, торговыми или другими видами советов или рекомендаций, предоставленных или одобренных TradingView. Подробнее читайте в Условиях использования.