OPEN-SOURCE SCRIPT
US Fed Rate Cut Historical Dates
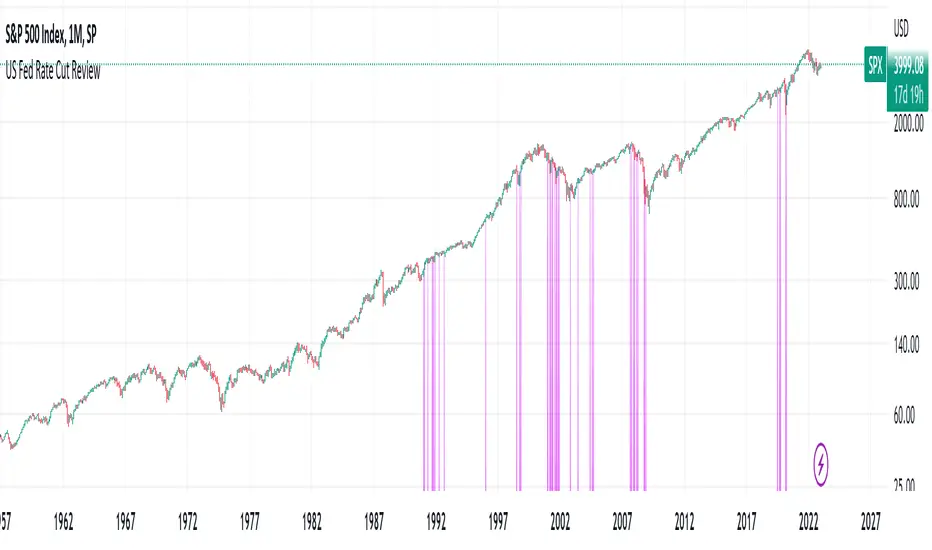
The script applies Purple (color can be changed) highlights to the days that the US Federal Reserve Cut interest rates. Data goes back to the 60's. This can be applied to any chart/timeframe to view how the asset behaved before/during/after Federal Rate cuts.
****This was updated as of Dec 2022... Any decisions after Dec 2022 will not show up in this indicator.
Versions may be updated periodically to include new data.
Hope this helps. Happy Trades
-SnarkyPuppy
****This was updated as of Dec 2022... Any decisions after Dec 2022 will not show up in this indicator.
Versions may be updated periodically to include new data.
Hope this helps. Happy Trades
-SnarkyPuppy
Скрипт с открытым кодом
В истинном духе TradingView, создатель этого скрипта сделал его открытым исходным кодом, чтобы трейдеры могли проверить и убедиться в его функциональности. Браво автору! Вы можете использовать его бесплатно, но помните, что перепубликация кода подчиняется нашим Правилам поведения.
Отказ от ответственности
Информация и публикации не предназначены для предоставления и не являются финансовыми, инвестиционными, торговыми или другими видами советов или рекомендаций, предоставленных или одобренных TradingView. Подробнее читайте в Условиях использования.