OPEN-SOURCE SCRIPT
Blai5 Astro Indicator

The original script was posted on ProRealCode by user Nicolas.
Trend indicator based on the calculation of time on operational stockings Blai5 Vigia. Need volumes to compute correctly.
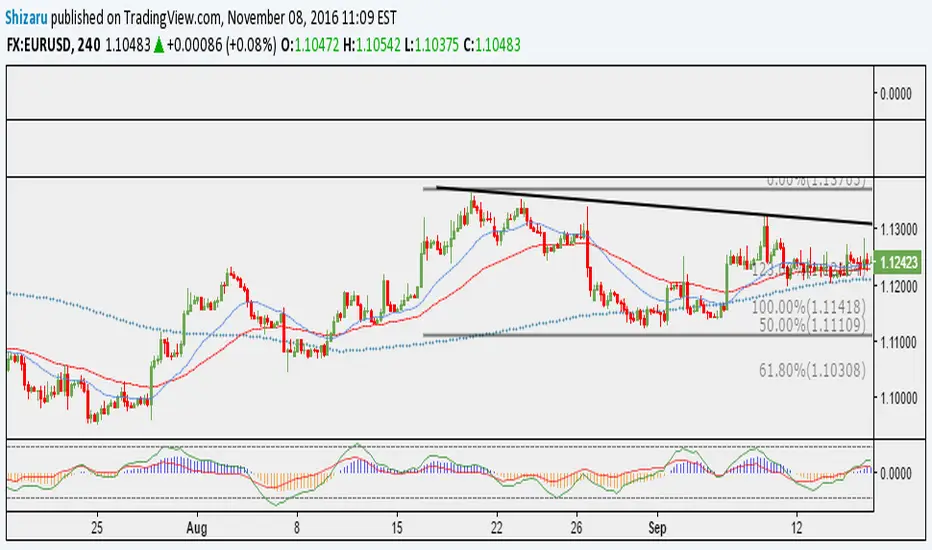
The indicator consists of three lines. The first (MR and MF) two form a ribbon that crosses regularly. Astro is the value of the difference between the two lines, and should be interpreted as we would MACD histogram.
The indicator can be configured and operated in various ways. It can be used simply making visible the Astro curve, or also presenting the "treadmill" that make up MR and MF; alone or with Astro.
Operating this trend indicator is not difficult, it gives many possibilities presenting a wealth of signs, more than the usual in this type of indicators. In principle, when MR (red) is higher than MF (blue), the time is positive and the value is likely to increase or, failing that, resist the descent; and vice versa.
It can be operated by crosses both lines (= crossings Astro on the zero line), but the most aggressive user will quickly realize that also offers the possibility to operate between extremes, slope and even by divergence, where the Astro tape is very rich.
The timing of the cycle (T) can be adjusted to better match assets and temporality wishing surgery.
Скрипт с открытым кодом
В истинном духе TradingView, создатель этого скрипта сделал его открытым исходным кодом, чтобы трейдеры могли проверить и убедиться в его функциональности. Браво автору! Вы можете использовать его бесплатно, но помните, что перепубликация кода подчиняется нашим Правилам поведения.
Отказ от ответственности
Информация и публикации не предназначены для предоставления и не являются финансовыми, инвестиционными, торговыми или другими видами советов или рекомендаций, предоставленных или одобренных TradingView. Подробнее читайте в Условиях использования.