OPEN-SOURCE SCRIPT
Dominance
Hi!
A script where you can play with 'Dominance" to make things more clear.
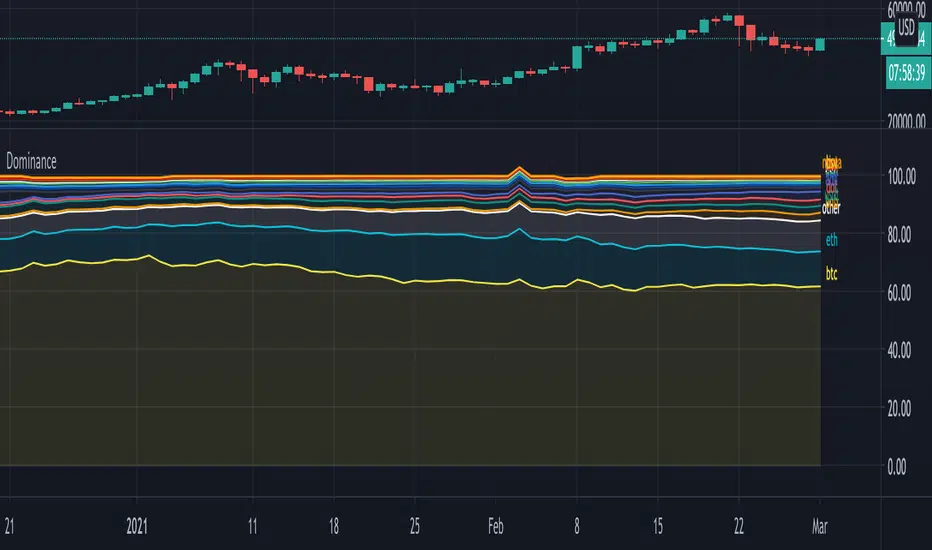
Initially we'll get this,
all available % dominance of BTC/Alts,...:

We can set an EMA on it to smooth things out:

We can filter so we keep want we want to see:

Finally, we can adjust the ratio's, which makes comparisons easier

Do mind, when you do this, don't look at the numbers!
They are changed, only to make it visually easier to see what goes up and down
Also, when doing this it may happen that lines flow in each other
Either way, you can get something like this:

You can see when BTC gets the inflow from ALTS, and USDT, you'll see that BNB recently is getting bigger, more inflow of USDT for some time now, etc...
Have fun!
A script where you can play with 'Dominance" to make things more clear.
Initially we'll get this,
all available % dominance of BTC/Alts,...:
We can set an EMA on it to smooth things out:
We can filter so we keep want we want to see:
Finally, we can adjust the ratio's, which makes comparisons easier
Do mind, when you do this, don't look at the numbers!
They are changed, only to make it visually easier to see what goes up and down
Also, when doing this it may happen that lines flow in each other
Either way, you can get something like this:
You can see when BTC gets the inflow from ALTS, and USDT, you'll see that BNB recently is getting bigger, more inflow of USDT for some time now, etc...
Have fun!
Скрипт с открытым кодом
В истинном духе TradingView, создатель этого скрипта сделал его открытым исходным кодом, чтобы трейдеры могли проверить и убедиться в его функциональности. Браво автору! Вы можете использовать его бесплатно, но помните, что перепубликация кода подчиняется нашим Правилам поведения.
Who are PineCoders?
tradingview.com/chart/SSP/yW5eOqtm-Who-are-PineCoders/
TG Pine Script® Q&A: t.me/PineCodersQA
- We cannot control our emotions,
but we can control our keyboard -
tradingview.com/chart/SSP/yW5eOqtm-Who-are-PineCoders/
TG Pine Script® Q&A: t.me/PineCodersQA
- We cannot control our emotions,
but we can control our keyboard -
Отказ от ответственности
Информация и публикации не предназначены для предоставления и не являются финансовыми, инвестиционными, торговыми или другими видами советов или рекомендаций, предоставленных или одобренных TradingView. Подробнее читайте в Условиях использования.