OPEN-SOURCE SCRIPT
Обновлено SAT - Sentiment Analysis Tool by Csth97
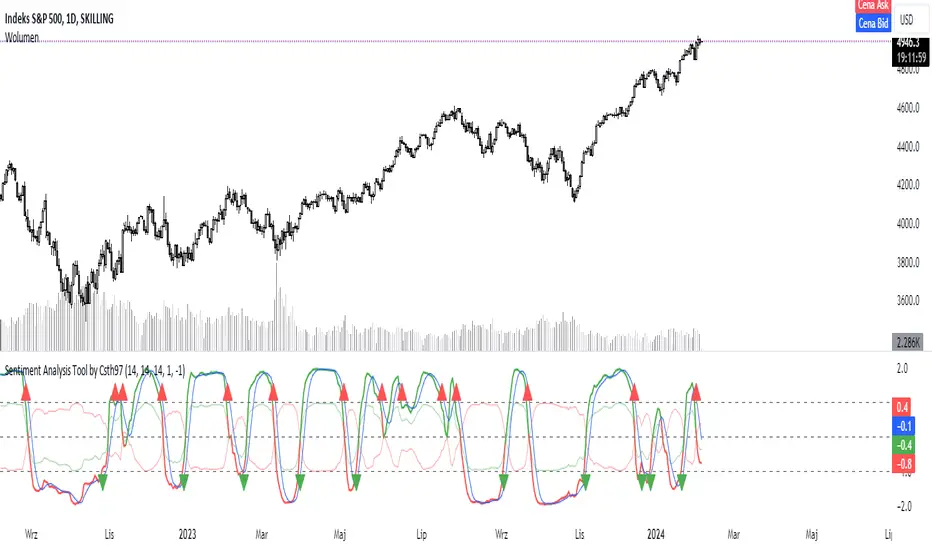
This code calculates the correlation between the ATR and the OBV of the price, and plots the difference between the positive and negative OBV correlations as a line. It also plots horizontal lines at the UP and DOWN levels, and signals bullish and bearish crosses when the difference line crosses those levels.
Информация о релизе
// This code calculates the correlation between the ATR and the OBV of the price, and plots the difference between the positive and negative OBV correlations as a line.//It also plots horizontal lines at the UP and DOWN levels, and signals bullish and bearish crosses when the difference line crosses those levels.
Скрипт с открытым кодом
В истинном духе TradingView, создатель этого скрипта сделал его открытым исходным кодом, чтобы трейдеры могли проверить и убедиться в его функциональности. Браво автору! Вы можете использовать его бесплатно, но помните, что перепубликация кода подчиняется нашим Правилам поведения.
Отказ от ответственности
Информация и публикации не предназначены для предоставления и не являются финансовыми, инвестиционными, торговыми или другими видами советов или рекомендаций, предоставленных или одобренных TradingView. Подробнее читайте в Условиях использования.