OPEN-SOURCE SCRIPT
parademi 5-8-13
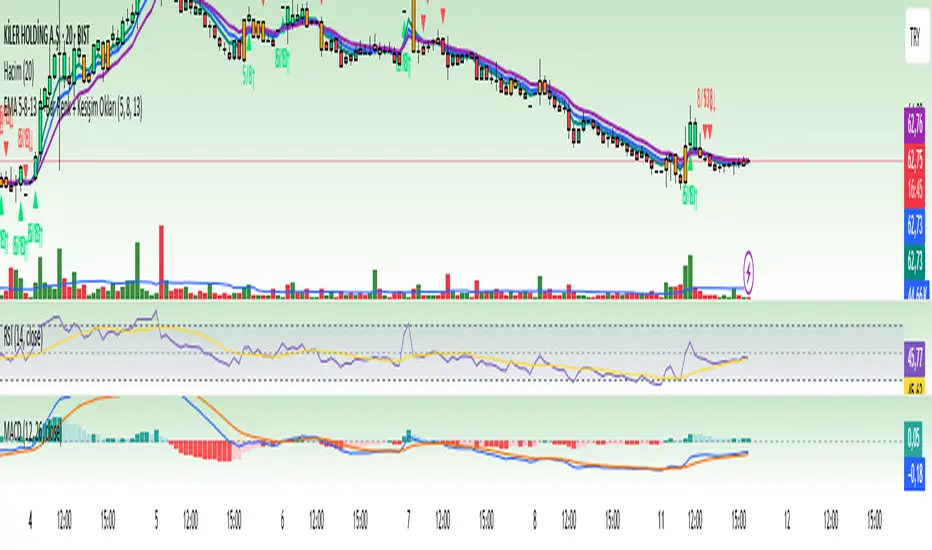
EMA 5-8-13 Trend & Crossover Indicator
This indicator helps you identify market trends and potential reversal points in a single tool. It uses three Exponential Moving Averages (EMA 5, EMA 8, and EMA 13) to determine trend direction and highlight important crossover signals.
Features:
Trend Detection:
When the price is above all three EMAs (5, 8, and 13), candles are colored green, indicating a strong uptrend.
When the price crosses EMA 8, candles turn orange, signaling a possible short-term change in momentum.
Crossover Signals:
When EMA 5 crosses above EMA 8, a green arrow appears below the candle, suggesting a potential buy signal.
When EMA 5 crosses below EMA 8, a red arrow appears above the candle, suggesting a potential sell signal.
Optional EMA 8 and EMA 13 crossover signals can also be displayed using the same logic.
Purpose:
This indicator visually clarifies trend direction and marks potential entry/exit points. It can be used on its own or combined with other technical tools such as volume, support/resistance levels, or momentum indicators for higher accuracy.
Скрипт с открытым кодом
В истинном духе TradingView, создатель этого скрипта сделал его открытым исходным кодом, чтобы трейдеры могли проверить и убедиться в его функциональности. Браво автору! Вы можете использовать его бесплатно, но помните, что перепубликация кода подчиняется нашим Правилам поведения.
Отказ от ответственности
Информация и публикации не предназначены для предоставления и не являются финансовыми, инвестиционными, торговыми или другими видами советов или рекомендаций, предоставленных или одобренных TradingView. Подробнее читайте в Условиях использования.