PROTECTED SOURCE SCRIPT
Обновлено Index Lead Lag
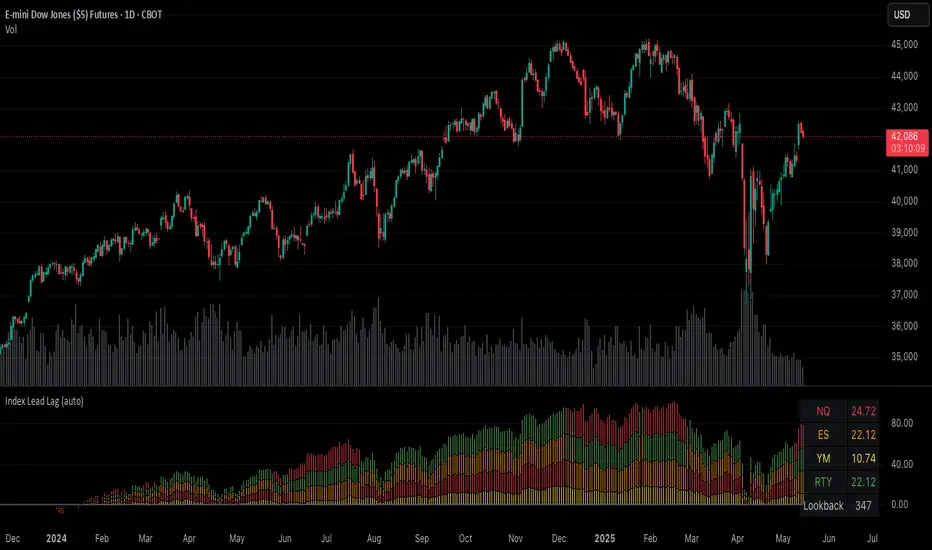
Plots the percent change of each index over a given input lookback window length.
Indices are color coded (and customizable) to identify their respective percent change in the stacked column plot.
Table at the bottom right shows the previously closed bar's percent changes.
Indicator indicates which indices are leading and lagging over the given lookback period.
Indices are color coded (and customizable) to identify their respective percent change in the stacked column plot.
Table at the bottom right shows the previously closed bar's percent changes.
Indicator indicates which indices are leading and lagging over the given lookback period.
Информация о релизе
Add index changes to status line visualizationИнформация о релизе
Updated default lookback length for improved visibility of trendИнформация о релизе
Added an optional highlight on the reference bar anchor for the current bar's percent change calculation. Highlighted bar appears `lookback window bars input` to the left of the current bar.Информация о релизе
Adds a vertical bar selector for the comparison start point. Click on the indicator then move the vertical bar to the desired chart data.Информация о релизе
Allow setting comparison anchor point between:* Time based using vertical selector bar (or timestamp input option)
* Fixed number of bars
Информация о релизе
bug fix with disabling the table viewИнформация о релизе
try that againИнформация о релизе
v1.1Added a zero reference line on the plot to distinguish positive and negative changes.
Скрипт с защищённым кодом
Этот скрипт опубликован с закрытым исходным кодом. Однако вы можете использовать его свободно и без каких-либо ограничений — читайте подробнее здесь.
Отказ от ответственности
Информация и публикации не предназначены для предоставления и не являются финансовыми, инвестиционными, торговыми или другими видами советов или рекомендаций, предоставленных или одобренных TradingView. Подробнее читайте в Условиях использования.