OPEN-SOURCE SCRIPT
Обновлено Stochastic RSI Heat Candles Overlay
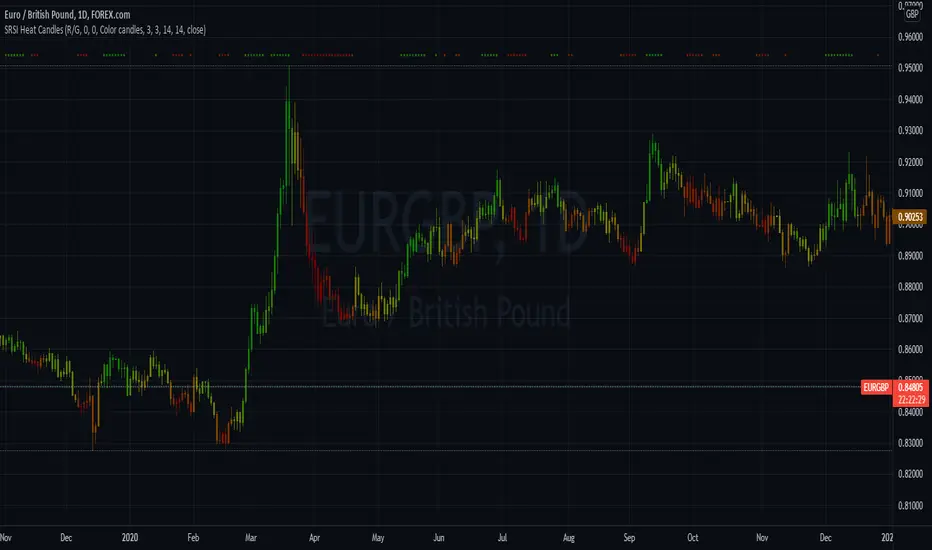
This script is based on the Stochastic RSI indicator.
Candles are dynamically colored with a customizable RGB shading directly generated from the average Stochastic RSI current value.
By default, colors represent the following status -> green is overgought & red is oversold.
Options:
Examples:


Notes:
Candles are dynamically colored with a customizable RGB shading directly generated from the average Stochastic RSI current value.
By default, colors represent the following status -> green is overgought & red is oversold.
Options:
- Shading colors: Choose between Red/Green, Green/Blue, and Blue/Red shadings to represent the SRSI heat.
- Invert colors: Switch colors of the selected shading.
- Third color: Select a value from 0 to 255 for the third color which does not vary.
- Transparency: Select the transparency value.
- Overlay style : Choose to color the whole candle, or only borders and wick.
- Show candle side: If you choose to fully fill candles with the SRSI heat color , enable this option to plot shapes representing the candles directions.
- Candle marks colors: Select bull and bear colors for direction shapes.
- Overbought and Oversold situations are also represented by colored shapes at the top of the chart.
- Standards Stochastic RSI parameters.
Examples:
Notes:
- Do not forget to bring the script to the front of your chart to avoid being covered by default candles.
- Next improvements would probably be a better coloring algorithm, however, do not hesitate to suggest any modifications in comments.
- Initially, I shared a Stochastic RSI Heat Bollinger Bands indicator which gave me the idea to develop this one, you can find it on my profile.
Информация о релизе
Useless lines removedСкрипт с открытым кодом
В истинном духе TradingView, создатель этого скрипта сделал его открытым исходным кодом, чтобы трейдеры могли проверить и убедиться в его функциональности. Браво автору! Вы можете использовать его бесплатно, но помните, что перепубликация кода подчиняется нашим Правилам поведения.
Отказ от ответственности
Информация и публикации не предназначены для предоставления и не являются финансовыми, инвестиционными, торговыми или другими видами советов или рекомендаций, предоставленных или одобренных TradingView. Подробнее читайте в Условиях использования.
Скрипт с открытым кодом
В истинном духе TradingView, создатель этого скрипта сделал его открытым исходным кодом, чтобы трейдеры могли проверить и убедиться в его функциональности. Браво автору! Вы можете использовать его бесплатно, но помните, что перепубликация кода подчиняется нашим Правилам поведения.
Отказ от ответственности
Информация и публикации не предназначены для предоставления и не являются финансовыми, инвестиционными, торговыми или другими видами советов или рекомендаций, предоставленных или одобренных TradingView. Подробнее читайте в Условиях использования.