OPEN-SOURCE SCRIPT
BTC - AUI 1: Macro Sentiment & On-Chain Composite
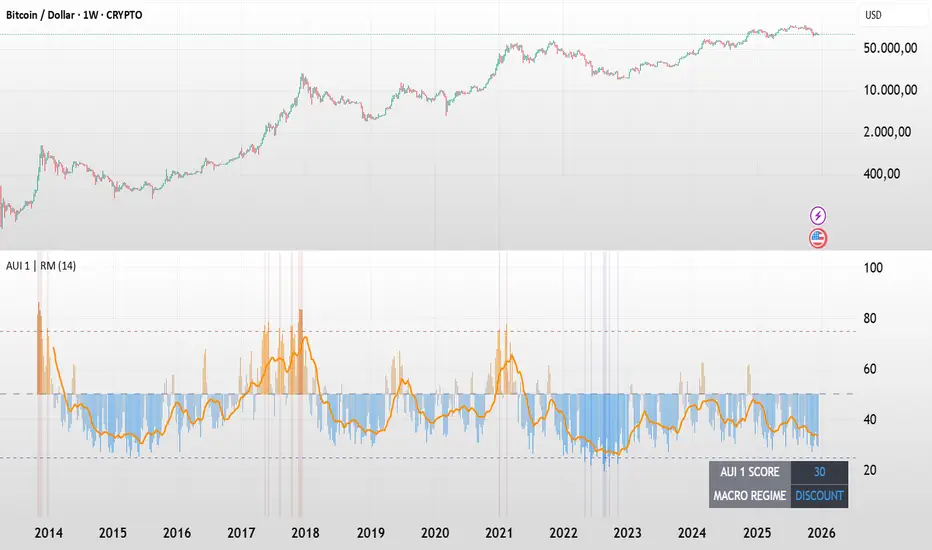
BTC - AUI 1: Macro Sentiment & On-Chain Composite | RM
Overview & Philosophy The AUI 1 (Another Ultimate Indicator, Volume 1) is a 10-pillar quantitative composite designed to solve the "noise problem" in Bitcoin analysis. Most traders fail because they rely on a single metric in isolation. The AUI 1 aggregates ten distinct dimensions of the network — from speculative flow to institutional extension — into a singular 0–100 score.
The 10-Pillar Quant Framework
Each pillar is mathematically normalized to a standardized 0 to 10 scale. The sum of these pillars creates the final 0–100 index:
1. BEAM (Adaptive Logarithmic Multiple)
• Method: Log-deviation from the 4-year cycle mean.
• Logic: Measures price distance from its fundamental growth curve.
(Credit: BitcoinEcon)
2. MVRV Z-Score (Statistical Distance)
• Method: Standard deviations between Market Cap and Realized Cap.
• Logic: Identifies historical "Fair Value" vs. "Bubble" extremes.
(Credit: M. Mahmudov & D. Puell)
3. Metcalfe’s Law (Network Utility)
• Method: Logarithmic scaling of Active Addresses.
• Logic: Ensures price growth is supported by actual user adoption.
(Credit: T. Peterson)
4. RHODL Proxy (Speculative Flow)
• Method: Supply rotation intensity between HODLers and New Money.
• Logic: Cycle peaks are defined by "Old Money" distributing to "New Money."
(Credit: Philip Swift)
5. AXIS Momentum (Structural Trend Intensity)
• Method: Dual-speed Rate of Change (RoC) fusion engine.
• Logic: Identifies the acceleration and "torque" of the macro trend.
(Credit: Rob_Maths)
6. Mayer Multiple (Institutional Extension)
• Method: Raw distance from the 200-day SMA.
• Logic: Tracks the primary anchor used by institutional mean-reversion desks.
(Credit: Trace Mayer)
7. Unrealized Profit (Financial Pressure)
• Method: Absolute MVRV Ratio mapping.
• Logic: Measures the financial "stress" or "greed" held by the average holder.
8. Retail Participation (Psychology Proxy)
• Method: Inverted Log-Average Transaction Size (USD).
• Logic: Declining transaction sizes historically signal retail FOMO (Euphoria).
9. Volatility Overextension (Structural Risk)
• Method: 30-day Standard Deviation relative to the mean.
• Logic: High-intensity volatility clusters often precede cycle trend-shifts.
10. Macro RSI (Cycle Maturity)
• Method: High-timeframe momentum saturation levels.
• Logic: Identifies the statistical "Buying Exhaustion" of a macro move.
(Credit: J. Welles Wilder Jr.)
How to Read the AXIS Quadrants
The AUI 1 uses a Seamless Heatmap to categorize the market into four specific macro regimes:
❄️ 0–25: FROZEN (Deep Blue) Maximum Opportunity. Structural capitulation where only long-term conviction remains. Historically the "Generational Wealth" window.
🔵 25–50: DISCOUNT (Light Blue to Gray) Value Accumulation. The market is cooling down; risk is mathematically low, and the network is building a structural floor.
🟠 50–75: EXPANSION (Gray to Orange) Trend Acceleration. Healthy bullish growth supported by network utility and positive momentum.
🔥 75–100: SCORCHED (Orange to Deep Red) Terminal Euphoria. Maximum Risk zone. Speculative FOMO is at its peak; the market is fundamentally overextended.
The Orange Signal Line
To filter short-term noise, the AUI 1 includes a Signal Smoothing Line (Parametrizable).
• Cycle Confirmation: Index Bars crossing above the Signal Line indicates trend acceleration.
• Peak Confirmation: If the Index Score rolls over and breaks below the Signal Line while in the SCORCHED zone, the cycle peak is likely confirmed.
Credits & Data Built by Rob_Maths (2025) using on-chain frameworks from Glassnode and IntoTheBlock. Special recognition to the pioneers: Murad Mahmudov, David Puell, Philip Swift, Trace Mayer, and Timothy Peterson.
Strategic Recommendation: For the most accurate macro cycle signals and to filter daily market noise, it is strongly recommended to use this indicator on the Weekly (1W) timeframe.
⚠️ Data Requirement Note: This quantitative composite utilizes professional on-chain data feeds, specifically GLASSNODE:BTC_ACTIVEADDRESSES, GLASSNODE:BTC_ACTIVE1Y, and INTOTHEBLOCK:BTC_MVRV. A TradingView paid plan (Essential or higher) may be required to access these institutional data streams.
Disclaimer This script is for macro-economic research purposes. It is a probabilistic model, not a crystal ball. Past performance is not a guarantee of future results.
Tags:
bitcoin, btc, on-chain, macro, composite, mvrv, rhodl, momentum, index, valuation, active-addresses, cycles, sentiment, risk, AUI, Rob Maths
Скрипт с открытым кодом
В истинном духе TradingView, создатель этого скрипта сделал его открытым исходным кодом, чтобы трейдеры могли проверить и убедиться в его функциональности. Браво автору! Вы можете использовать его бесплатно, но помните, что перепубликация кода подчиняется нашим Правилам поведения.
Отказ от ответственности
Информация и публикации не предназначены для предоставления и не являются финансовыми, инвестиционными, торговыми или другими видами советов или рекомендаций, предоставленных или одобренных TradingView. Подробнее читайте в Условиях использования.