OPEN-SOURCE SCRIPT
Обновлено Liquidity Indicator
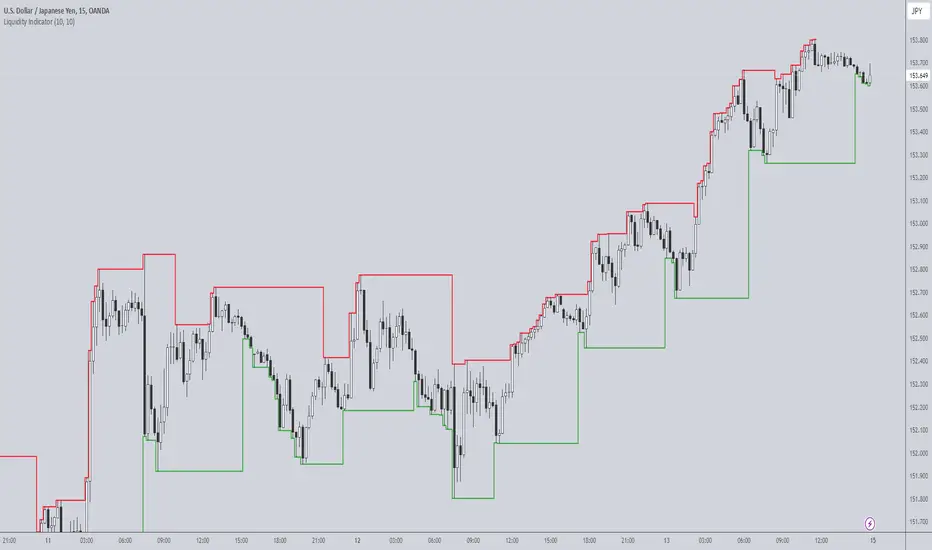
The Liquidity Indicator helps identify key price levels where liquidity may be concentrated by highlighting local highs and local lows on the chart. These levels are calculated using a lookback period to determine the highest and lowest points in the recent price action.
Local Highs: Displayed as red lines, these indicate recent peaks where price has experienced rejection or a possible reversal point.
Local Lows: Displayed as green lines, these represent recent troughs where price may find support or experience a bounce.
This indicator is useful for spotting potential areas of interest for price reversal or continuation, as high liquidity zones may lead to more significant price movements.
Key Features:
Adjustable lookback period to define the scope for identifying local highs and lows.
Continuous plotting without any time restrictions, providing real-time insights into liquidity conditions.
Alerts available for when a local high or local low is detected, enabling timely market analysis.
Use Case:
This indicator can be used in conjunction with other technical analysis tools or strategies to help identify significant price levels where liquidity could impact price action. It is suitable for both intraday and swing traders looking for key price zones where potential reversals or continuations might occur.
Информация о релизе
The ability to create separate lookback periods for the upper and lower liquidity lines has been added.Информация о релизе
The ability to create separate lookback periods for the upper and lower liquidity lines has been added.Скрипт с открытым кодом
В истинном духе TradingView, создатель этого скрипта сделал его открытым исходным кодом, чтобы трейдеры могли проверить и убедиться в его функциональности. Браво автору! Вы можете использовать его бесплатно, но помните, что перепубликация кода подчиняется нашим Правилам поведения.
Отказ от ответственности
Информация и публикации не предназначены для предоставления и не являются финансовыми, инвестиционными, торговыми или другими видами советов или рекомендаций, предоставленных или одобренных TradingView. Подробнее читайте в Условиях использования.
Скрипт с открытым кодом
В истинном духе TradingView, создатель этого скрипта сделал его открытым исходным кодом, чтобы трейдеры могли проверить и убедиться в его функциональности. Браво автору! Вы можете использовать его бесплатно, но помните, что перепубликация кода подчиняется нашим Правилам поведения.
Отказ от ответственности
Информация и публикации не предназначены для предоставления и не являются финансовыми, инвестиционными, торговыми или другими видами советов или рекомендаций, предоставленных или одобренных TradingView. Подробнее читайте в Условиях использования.