OPEN-SOURCE SCRIPT
Обновлено RoC Momentum Cycle
RoC Momentum Cycles (RMC) is derived from RoC (Rate of Change) indicator.
Motivation behind RMC: Addressing RoC’s Shortcomings
While the Rate of Change (RoC) indicator is a valuable tool for assessing momentum, it has notable limitations that traders must be aware of. One of the primary challenges with the traditional RoC is its sensitivity to price fluctuations, which can lead to false signals in volatile markets. This often results in premature entries or exits, impacting trading performance.
By smoothing out the RoC calculations and focusing on more consistent signal generation (using SMA on smoothed RoC), RMC offers a more consistent representation of price trends.
Momentum Cycles
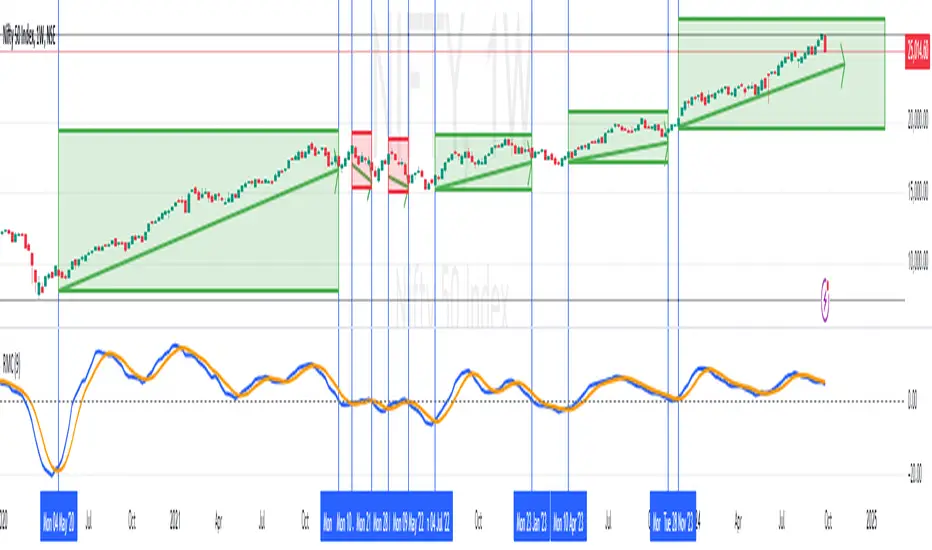
RMC helps visualize momentum cycles in a much better way compared to RoC.
Motivation behind RMC: Addressing RoC’s Shortcomings
While the Rate of Change (RoC) indicator is a valuable tool for assessing momentum, it has notable limitations that traders must be aware of. One of the primary challenges with the traditional RoC is its sensitivity to price fluctuations, which can lead to false signals in volatile markets. This often results in premature entries or exits, impacting trading performance.
By smoothing out the RoC calculations and focusing on more consistent signal generation (using SMA on smoothed RoC), RMC offers a more consistent representation of price trends.
Momentum Cycles
RMC helps visualize momentum cycles in a much better way compared to RoC.
- Long Momentum Cycle: A cross-over of smoothed RoC (blue line) above averaged signal (orange line) below zero marks start of a new potential upside cycle which ends when the blue line comes back to zero line from above.
- Short Momentum Cycle: A cross-under of blue line below orange line above zero marks beginning of a potential downside cycle which ends when the blue line comes back to zero from below.
Информация о релизе
Updated with annotated chart and fixed a typo in script.Информация о релизе
Added histogram to the indicator. Enabled by default but can be disabled from the style section under indicator settings.Скрипт с открытым кодом
В истинном духе TradingView, создатель этого скрипта сделал его открытым исходным кодом, чтобы трейдеры могли проверить и убедиться в его функциональности. Браво автору! Вы можете использовать его бесплатно, но помните, что перепубликация кода подчиняется нашим Правилам поведения.
True Wave Scanner - scanner.elliottwavestrading.com
Отказ от ответственности
Информация и публикации не предназначены для предоставления и не являются финансовыми, инвестиционными, торговыми или другими видами советов или рекомендаций, предоставленных или одобренных TradingView. Подробнее читайте в Условиях использования.
Скрипт с открытым кодом
В истинном духе TradingView, создатель этого скрипта сделал его открытым исходным кодом, чтобы трейдеры могли проверить и убедиться в его функциональности. Браво автору! Вы можете использовать его бесплатно, но помните, что перепубликация кода подчиняется нашим Правилам поведения.
True Wave Scanner - scanner.elliottwavestrading.com
Отказ от ответственности
Информация и публикации не предназначены для предоставления и не являются финансовыми, инвестиционными, торговыми или другими видами советов или рекомендаций, предоставленных или одобренных TradingView. Подробнее читайте в Условиях использования.