PROTECTED SOURCE SCRIPT
Bar%Change
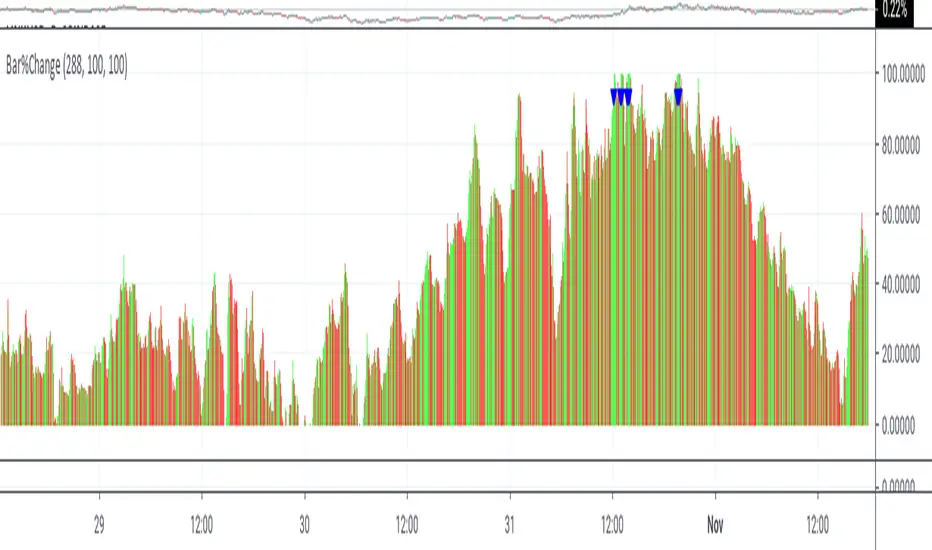
This is a visual study to hilight the change is candlestick by percentage. the percentages are calculated by the duration of the momentum. This study is not designed for automated trading.
The triangles show buys/sells on the basis of momentum. Buys occur below momentum, while sells occur above.
Percentages are shown in red if closing less then opening or closing less then previous closing, otherwise green.
Buying and selling changes in candlestick percentages are user configurable.
The triangles show buys/sells on the basis of momentum. Buys occur below momentum, while sells occur above.
Percentages are shown in red if closing less then opening or closing less then previous closing, otherwise green.
Buying and selling changes in candlestick percentages are user configurable.
Скрипт с защищённым кодом
Этот скрипт опубликован с закрытым исходным кодом. Однако вы можете использовать его свободно и без каких-либо ограничений — читайте подробнее здесь.
Join my Patreon for exclusive access to Jackrabbit TV,
patreon.com/RD3277
patreon.com/RD3277
Отказ от ответственности
Информация и публикации не предназначены для предоставления и не являются финансовыми, инвестиционными, торговыми или другими видами советов или рекомендаций, предоставленных или одобренных TradingView. Подробнее читайте в Условиях использования.