OPEN-SOURCE SCRIPT
Wolfe Waves [BigBeluga]

🔵 OVERVIEW
The Wolfe Waves pattern was first introduced by Bill Wolfe, a trader and analyst in the 1980s–1990s who specialized in market geometry and natural rhythm cycles. Wolfe observed that price often forms symmetrical wave structures that anticipate equilibrium points where supply and demand meet. These formations, called Wolfe Waves, gained popularity as a reliable pattern for forecasting both short- and long-term reversals.
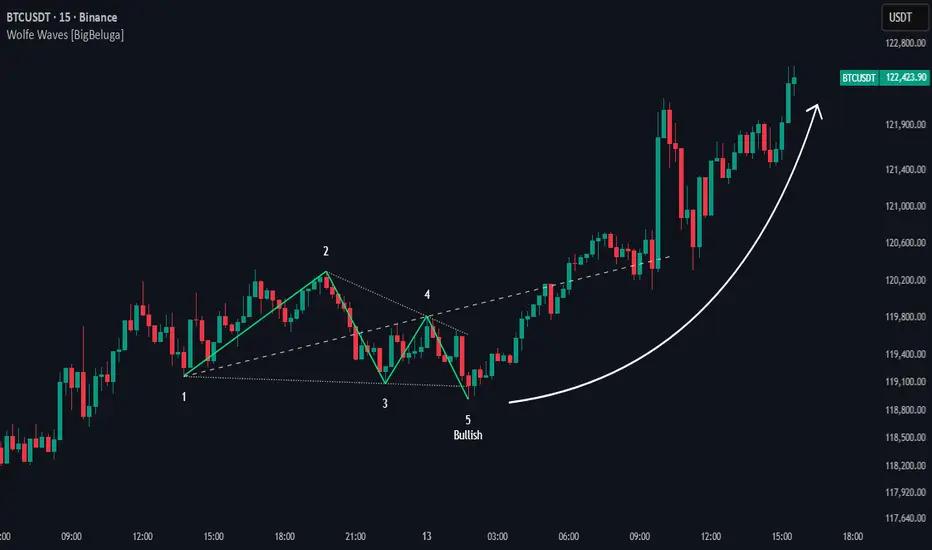
The Wolfe Waves [BigBeluga] indicator automatically detects these patterns in real time. It tracks sequences of five pivots (points 1 through 5) and connects them with wave lines. Users can select either Bullish or Bearish Wolfe Waves depending on their trading bias. When the pattern fails, the lines automatically turn red to highlight invalidation.
🔵 CONCEPTS
🔵 FEATURES
🔵 HOW TO USE
🔵 CONCLUSION
The Wolfe Waves [BigBeluga] brings the classic Wolfe Wave theory into an automated TradingView tool. Inspired by Bill Wolfe’s original concept of natural market cycles, this indicator detects, labels, and validates Wolfe Waves in real time. With automatic invalidation marking and customizable settings, it offers traders a structured way to harness one of the most well-known geometric reversal patterns.
The Wolfe Waves pattern was first introduced by Bill Wolfe, a trader and analyst in the 1980s–1990s who specialized in market geometry and natural rhythm cycles. Wolfe observed that price often forms symmetrical wave structures that anticipate equilibrium points where supply and demand meet. These formations, called Wolfe Waves, gained popularity as a reliable pattern for forecasting both short- and long-term reversals.
The Wolfe Waves [BigBeluga] indicator automatically detects these patterns in real time. It tracks sequences of five pivots (points 1 through 5) and connects them with wave lines. Users can select either Bullish or Bearish Wolfe Waves depending on their trading bias. When the pattern fails, the lines automatically turn red to highlight invalidation.
🔵 CONCEPTS
- Five-Point Structure – Wolfe Waves are defined by five pivots (1–5), which together form the basis of the wave pattern.
- Bullish Pattern – Occurs when price compresses downward into point 5, signaling a potential upside reversal.
- Bearish Pattern – Occurs when price extends upward into point 5, forecasting a downside reversal.
- Validation & Failure – The pattern is considered valid once all five pivots form; if price fails to respect the expected breakout, the indicator marks the structure as broken with red lines.
🔵 FEATURES
- Automatic detection of Bullish and Bearish Wolfe Waves.
- Labels each pivot (1–5) on the chart for clarity.
- Draws connecting lines between pivots to visualize the wave structure.
- Projects target/dashed lines (EPA/ETA) based on Wolfe Wave geometry.
- Lines automatically turn red when the pattern is broken, giving immediate feedback.
- Customizable color scheme for bullish (lime) and bearish (orange) waves.
- Adjustable sensitivity for pivot detection.
🔵 HOW TO USE
- Choose between Bullish or Bearish mode depending on your analysis.
- Watch for the formation of all five pivots; the indicator labels them clearly.
- Look for potential entries near point 5, with the expectation that price will travel toward the projected EPA line.
- Use invalidation (lines turning red) as a risk management warning to exit failed setups.
- Combine with momentum, volume, or higher-timeframe analysis to increase reliability.
🔵 CONCLUSION
The Wolfe Waves [BigBeluga] brings the classic Wolfe Wave theory into an automated TradingView tool. Inspired by Bill Wolfe’s original concept of natural market cycles, this indicator detects, labels, and validates Wolfe Waves in real time. With automatic invalidation marking and customizable settings, it offers traders a structured way to harness one of the most well-known geometric reversal patterns.
Скрипт с открытым кодом
В истинном духе TradingView, создатель этого скрипта сделал его открытым исходным кодом, чтобы трейдеры могли проверить и убедиться в его функциональности. Браво автору! Вы можете использовать его бесплатно, но помните, что перепубликация кода подчиняется нашим Правилам поведения.
🔵Gain access to our powerful tools : bigbeluga.com/tv
🔵Join our free discord for updates : bigbeluga.com/discord
All scripts & content provided by BigBeluga are for informational & educational purposes only.
🔵Join our free discord for updates : bigbeluga.com/discord
All scripts & content provided by BigBeluga are for informational & educational purposes only.
Отказ от ответственности
Информация и публикации не предназначены для предоставления и не являются финансовыми, инвестиционными, торговыми или другими видами советов или рекомендаций, предоставленных или одобренных TradingView. Подробнее читайте в Условиях использования.