PROTECTED SOURCE SCRIPT
Volatility Heat-Map, momentum ribbon and divergence detector
✅ Summary:
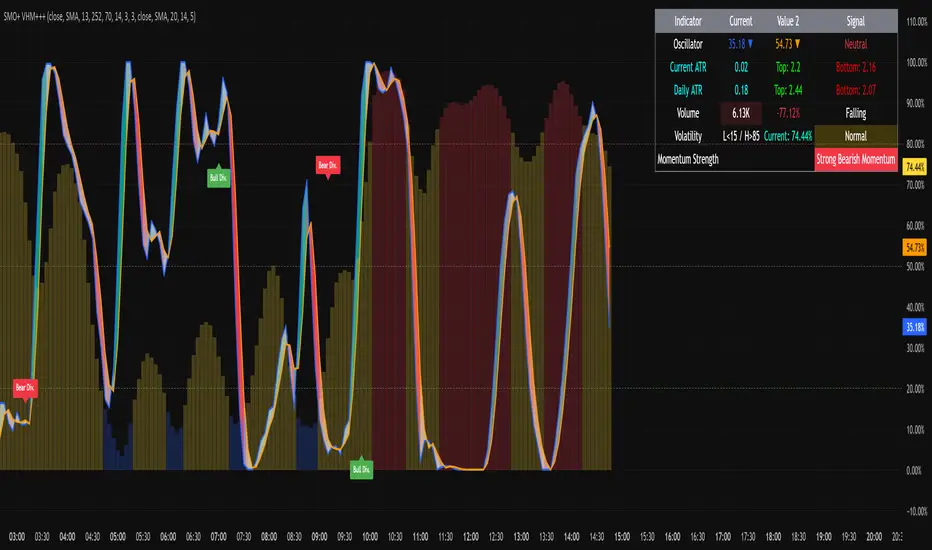
This is a comprehensive volatility + momentum + volume + ATR dashboard with table visualization, momentum ribbon, and divergence detection. It’s optimized for visual clarity with dynamic coloring and is suitable for both trend-following and mean-reversion traders.
Table shows:
Oscillator values with arrows and K/D status.
Current & Daily ATR with tops/bottoms.
Volume & % change, rising/falling indicator.
Volatility regime (Low/Normal/High) with color coding.
Momentum strength (strong/weak bullish/bearish).
Oscillator
stoch = hh != ll ? 100 * (src - ll) / (hh - ll) : 0
k = smooth(stoch, kSmoothing)
d = smooth(k, dSmoothing)
Standard stochastic normalization.
Smoothing based on selected type (SMA/EMA/WMA).
diff between K and D is normalized for the momentum ribbon color:
Greenish for bullish, red for bearish, silver for neutral.
Overbought / Oversold lines: 80/20, midline at 50.
4. BBWP Calculation
bbwp = f_bbwp(i_priceSrc, i_bbwpLen, i_bbwpLkbk, i_basisType)
bbwpSMA5 = f_maType(bbwp, 5, "SMA")
Heatmap Thresholds:
Low < 15%
High > 85%
Otherwise Normal.
Colors dynamically assigned for histogram and table background.
Plotted as columns if table
Bullish and Bearish divergence labels plotted, both regular and hidden.
Скрипт с защищённым кодом
Этот скрипт опубликован с закрытым исходным кодом. Однако вы можете использовать его свободно и без каких-либо ограничений — читайте подробнее здесь.
Want to join a safe community full of like-minded individuals that work together, not against each other? Join Xtrader! Link for more amazing indicators and support.
discord.gg/NHjztdYv6U
discord.gg/NHjztdYv6U
Отказ от ответственности
Все виды контента, которые вы можете увидеть на TradingView, не являются финансовыми, инвестиционными, торговыми или любыми другими рекомендациями. Мы не предоставляем советы по покупке и продаже активов. Подробнее — в Условиях использования TradingView.