OPEN-SOURCE SCRIPT
Обновлено 50% Candle Retrace
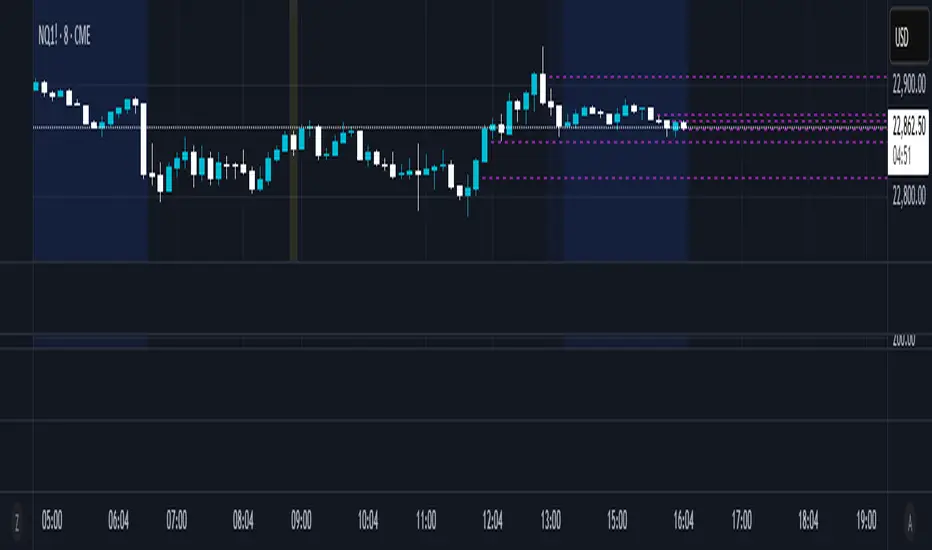
This custom indicator draws a horizontal line at the 50% retracement level of each candlestick on the chart. It calculates the midpoint between the high and low of each candle, which is often used by traders to identify potential entry, exit and take-profit levels. Once price action returns to an untouched level, the line will be removed, leaving only the levels where price action is still missing.
Key Features:
Timeframe: Works on all timeframes.
Line Color: Customize the line color to suit your charting preferences.
Line Width: Adjust the thickness of the retracement line for better visibility.
Line Style: Choose between solid, dotted, or dashed lines.
Up/Down Candle Selection: Option to only display retracement lines for up (bullish) candles, down (bearish) candles, or both.
Full Customization: Control the transparency (opacity) of the line for enhanced visual clarity.
Simple Setup: No complicated settings – simply choose your preferred color, line style, and visibility options.
This indicator is perfect for traders who prefer to use price action and retracement levels to identify potential trade opportunities.
How It Works:
The indicator automatically calculates the 50% level (midpoint) for each candlestick, drawing a line at this level. It will only draw lines for candles that match your chosen criteria (up or down candles), ensuring the chart remains clean and relevant to your trading strategy. Lines are automatically removed as soon as price crosses them.
Информация о релизе
This custom indicator draws a horizontal line at the 50% retracement level of each candlestick on the chart. It calculates the midpoint between the high and low of each candle, which is often used by traders to identify potential entry, exit and take-profit levels. Once price action returns to an untouched level, the line will be removed, leaving only the levels where price action is still missing.Key Features:
Timeframe: Works on all timeframes.
Line Color: Customize the line color to suit your charting preferences.
Line Width: Adjust the thickness of the retracement line for better visibility.
Line Style: Choose between solid, dotted, or dashed lines.
Up/Down Candle Selection: Option to only display retracement lines for up (bullish) candles, down (bearish) candles, or both.
Full Customization: Control the transparency (opacity) of the line for enhanced visual clarity.
Simple Setup: No complicated settings – simply choose your preferred color, line style, and visibility options.
This indicator is perfect for traders who prefer to use price action and retracement levels to identify potential trade opportunities.
How It Works:
The indicator automatically calculates the 50% level (midpoint) for each candlestick, drawing a line at this level. It will only draw lines for candles that match your chosen criteria (up or down candles), ensuring the chart remains clean and relevant to your trading strategy. Lines are automatically removed as soon as price crosses them.
Информация о релизе
v2.0 - Add user input to select current day onlyИнформация о релизе
Chart cleanupСкрипт с открытым кодом
В истинном духе TradingView, создатель этого скрипта сделал его открытым исходным кодом, чтобы трейдеры могли проверить и убедиться в его функциональности. Браво автору! Вы можете использовать его бесплатно, но помните, что перепубликация кода подчиняется нашим Правилам поведения.
Отказ от ответственности
Информация и публикации не предназначены для предоставления и не являются финансовыми, инвестиционными, торговыми или другими видами советов или рекомендаций, предоставленных или одобренных TradingView. Подробнее читайте в Условиях использования.
Скрипт с открытым кодом
В истинном духе TradingView, создатель этого скрипта сделал его открытым исходным кодом, чтобы трейдеры могли проверить и убедиться в его функциональности. Браво автору! Вы можете использовать его бесплатно, но помните, что перепубликация кода подчиняется нашим Правилам поведения.
Отказ от ответственности
Информация и публикации не предназначены для предоставления и не являются финансовыми, инвестиционными, торговыми или другими видами советов или рекомендаций, предоставленных или одобренных TradingView. Подробнее читайте в Условиях использования.