OPEN-SOURCE SCRIPT
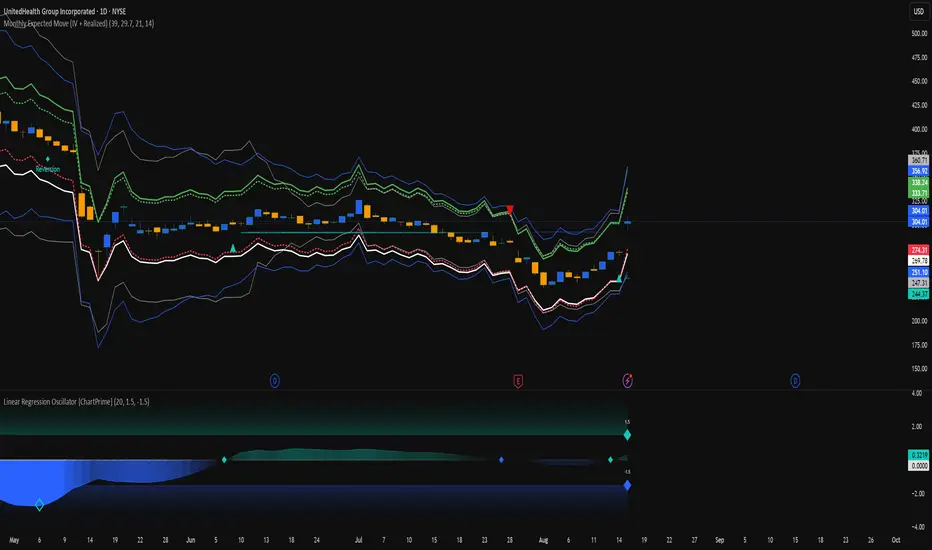
Monthly Expected Move (IV + Realized)
What it does
Overlays 1-month expected move bands on price using both forward-looking options data and backward-looking realized movement:
IV30 band — from your pasted 30-day implied vol (%)
Straddle band — from your pasted ATM ~30-DTE call+put total
HV band — from Historical Volatility computed on-chart
ATR band — from ATR% extrapolated to ~1 trading month
Use it to quickly answer: “How much could this stock move in ~1 month?” and “Is the market now pricing more/less movement than we’ve actually been getting?”
Inputs (quick)
Implied (forward-looking)
Use IV30 (%) — paste annualized IV30 from your options platform.
Use ATM 30-DTE Straddle — paste Call+Put total (per share) at the ATM strike, ~30 DTE.
Realized (backward-looking)
HV lookback (days) — default 21 (≈1 trading month).
ATR length — default 14.
Note: TradingView can’t fetch option data automatically. Paste the IV30 % or the straddle total you read from your broker (use Mark/mid prices).
How it’s calculated
IV band (±%) = IV30 × √(21/252) (annualized → ~1-month).
Straddle band (±%) = (ATM Call + Put) / Spot to that expiry (≈30 DTE).
HV band (±%) = stdev(log returns, N) × √252 × √(21/252).
ATR band (±%) = (ATR(len)/Close) × √21.
All bands are plotted as upper/lower envelopes around price, plus an on-chart readout of each ±% for quick scanning.
How to use it (at a glance)
IV/Straddle bands wider than HV/ATR → market expects bigger movement than recent actuals (possible catalyst/expansion).
All bands narrow → likely a low-mover; look elsewhere if you want action.
HV > IV → realized swings exceed current pricing (mean-reversion or vol bleed often follows).
Pro tips
For ATM straddle: pick the expiry closest to ~30 DTE, use the ATM strike (closest to spot), and add Call Mark + Put Mark (per share). If the exact ATM strike isn’t quoted, average the two neighboring strikes.
The simple straddle/spot heuristic can read slightly below the IV-derived 1σ; that’s normal.
Keep the chart on daily timeframe—the math assumes trading-day conventions (~252/yr, ~21/mo).
Скрипт с открытым кодом
В истинном духе TradingView, создатель этого скрипта сделал его открытым исходным кодом, чтобы трейдеры могли проверить и убедиться в его функциональности. Браво автору! Вы можете использовать его бесплатно, но помните, что перепубликация кода подчиняется нашим Правилам поведения.
Отказ от ответственности
Информация и публикации не предназначены для предоставления и не являются финансовыми, инвестиционными, торговыми или другими видами советов или рекомендаций, предоставленных или одобренных TradingView. Подробнее читайте в Условиях использования.