Market Sentiment Indicator
Class: hybrid – trend oscillator
Trading type: any
Time frame: any
Purpose: trend detection, reverse points detection
Level of aggressiveness: any
Indicator «Market Sentiment Indicator» (MSI) is used to detect dominating market sentiments and to search for the points of market sentiments change.
Domination of bullish sentiments means that “buy” trades are preferable. In case of bearish sentiments “sell” trades should prevail. Also indicator “MSI” can detect neutral market sentiments (the absence of dominating tendency), which means the presence of flat in the price dynamics.
Entering the extreme zones means that current market sentiments may change soon. This may act as a reverse signal.
Summarizing «Market Sentiment Indicator» provides additional information for successful trading.
Structure of the indicator
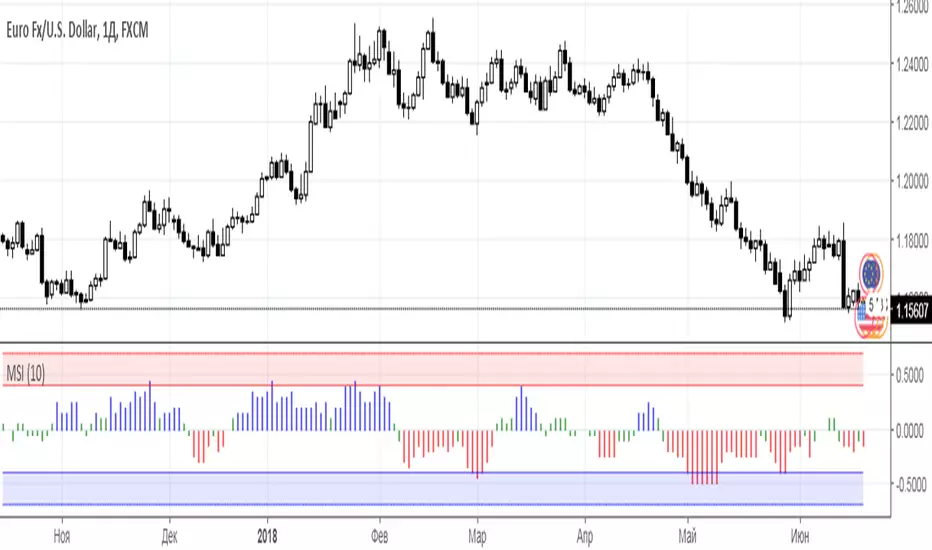
Indicator consists of the following elements:
- Histogram of market sentiments – is presented with 3 color gammas: blue color (bullish sentiments are dominating), red color (bearish sentiments are dominating), red color (neutral sentiments are present in the market),
- Red zone – bullish extreme zone, warns that current upward trend is ready for correction. Entering this zone is a signal for partial profit fixation for long positions;
- Blue zone – bearish extreme zone, warns that current downward trend is ready for correction. Entering this zone is a signal for partial profit fixation for short positions.
Input parameters of the indicator
To set up the indicator a “MSI period” parameter is used. It shows how many previous periods are used to calculate the MSI. The bigger the period is the more conservative signals are and vice versa.
Rules of trading
The main purpose of this indicator is detection of prevailing market sentiments: bullish (blue color of histogram), bearish (red color of histogram) and neutral (green color of histogram).
Accordingly in case of bulls’ domination preference should be given to purchases, in the bear market – to sell trades. Neutral state of the market is a reason to trade with no any preferences.
Entering the extreme zones is a reason for partial profit fixation of positions opened in current tendency.
Exit from the extreme zones is a strong reversal signal.
Скрипт с ограниченным доступом
Только пользователи, одобренные автором, могут получить доступ к этому скрипту. Вам нужно отправить запрос и получить разрешение на его использование. Обычно доступ предоставляется после оплаты. Для получения подробной информации следуйте инструкциям автора ниже или свяжитесь с Trade24Fx напрямую.
TradingView НЕ рекомендует платить за скрипт или использовать его, если вы не доверяете его автору и не понимаете, как скрипт работает. Вы всегда можете найти бесплатные скрипты с открытым исходным кодом в Скриптах сообщества.
Инструкции от автора
bit.ly/2oBvkHY
Больше информации на нашем ютьюб-канале
youtube.com/channel/UCYEOurJfasXWyYnrriGwsqQ
Отказ от ответственности
Скрипт с ограниченным доступом
Только пользователи, одобренные автором, могут получить доступ к этому скрипту. Вам нужно отправить запрос и получить разрешение на его использование. Обычно доступ предоставляется после оплаты. Для получения подробной информации следуйте инструкциям автора ниже или свяжитесь с Trade24Fx напрямую.
TradingView НЕ рекомендует платить за скрипт или использовать его, если вы не доверяете его автору и не понимаете, как скрипт работает. Вы всегда можете найти бесплатные скрипты с открытым исходным кодом в Скриптах сообщества.
Инструкции от автора
bit.ly/2oBvkHY
Больше информации на нашем ютьюб-канале
youtube.com/channel/UCYEOurJfasXWyYnrriGwsqQ