OPEN-SOURCE SCRIPT
Buffett Indicator (Wilshire 5000 / GDP)
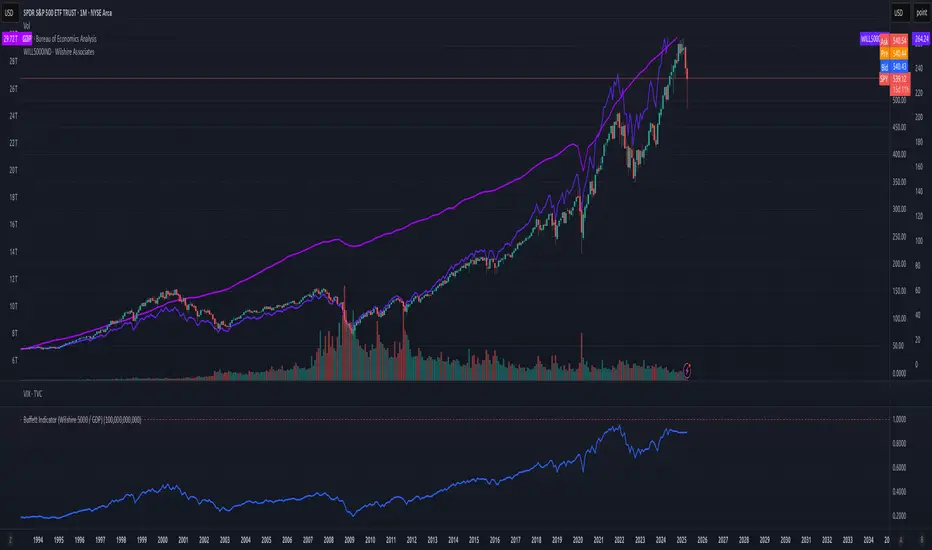
The Buffett Indicator (Wilshire 5000 / GDP) is a macroeconomic metric used to assess whether the U.S. stock market is overvalued or undervalued. It is calculated by dividing the total market capitalization (represented by the Wilshire 5000 Index) by the U.S. Gross Domestic Product (GDP). A value above 1 (or 100%) may indicate an overvalued market, while a value below 1 suggests potential undervaluation. This indicator is best suited for long-term investment analysis.
Скрипт с открытым кодом
В истинном духе TradingView автор этого скрипта опубликовал его с открытым исходным кодом, чтобы трейдеры могли понять, как он работает, и проверить на практике. Вы можете воспользоваться им бесплатно, но повторное использование этого кода в публикации регулируется Правилами поведения.
Отказ от ответственности
Все виды контента, которые вы можете увидеть на TradingView, не являются финансовыми, инвестиционными, торговыми или любыми другими рекомендациями. Мы не предоставляем советы по покупке и продаже активов. Подробнее — в Условиях использования TradingView.