OPEN-SOURCE SCRIPT
Обновлено Daily High Low Movement
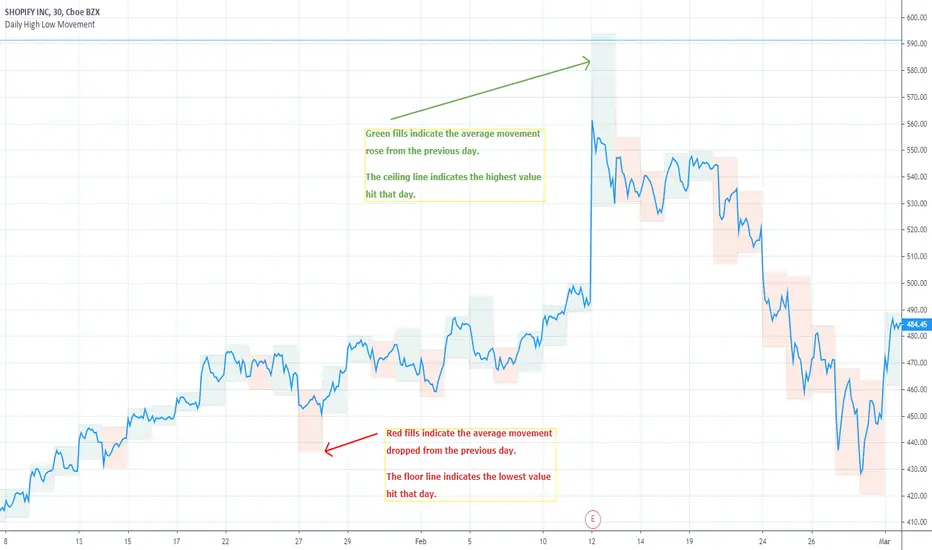
Indicates the daily high and low drawn by green and red lines. Fill blocks indicate the average value movement relevant to the previous day. Green fills indicate that the value is moving higher than the previous day and red meaning lower.
 BA
BA
Информация о релизе
Updating the comment for an example of use.Информация о релизе
This capture example shows how to use it for a trailing stop loss. You'll want to never intersect the blocks because the blocks indicate the daily volatility range.Информация о релизе
Updated example chart.Increased opacity of default fills.
Информация о релизе
Updated chart example.Скрипт с открытым кодом
В истинном духе TradingView, создатель этого скрипта сделал его открытым исходным кодом, чтобы трейдеры могли проверить и убедиться в его функциональности. Браво автору! Вы можете использовать его бесплатно, но помните, что перепубликация кода подчиняется нашим Правилам поведения.
Отказ от ответственности
Информация и публикации не предназначены для предоставления и не являются финансовыми, инвестиционными, торговыми или другими видами советов или рекомендаций, предоставленных или одобренных TradingView. Подробнее читайте в Условиях использования.
Скрипт с открытым кодом
В истинном духе TradingView, создатель этого скрипта сделал его открытым исходным кодом, чтобы трейдеры могли проверить и убедиться в его функциональности. Браво автору! Вы можете использовать его бесплатно, но помните, что перепубликация кода подчиняется нашим Правилам поведения.
Отказ от ответственности
Информация и публикации не предназначены для предоставления и не являются финансовыми, инвестиционными, торговыми или другими видами советов или рекомендаций, предоставленных или одобренных TradingView. Подробнее читайте в Условиях использования.