DR/IDR Sessions with Standard Deviation (v1.5)
Key features:
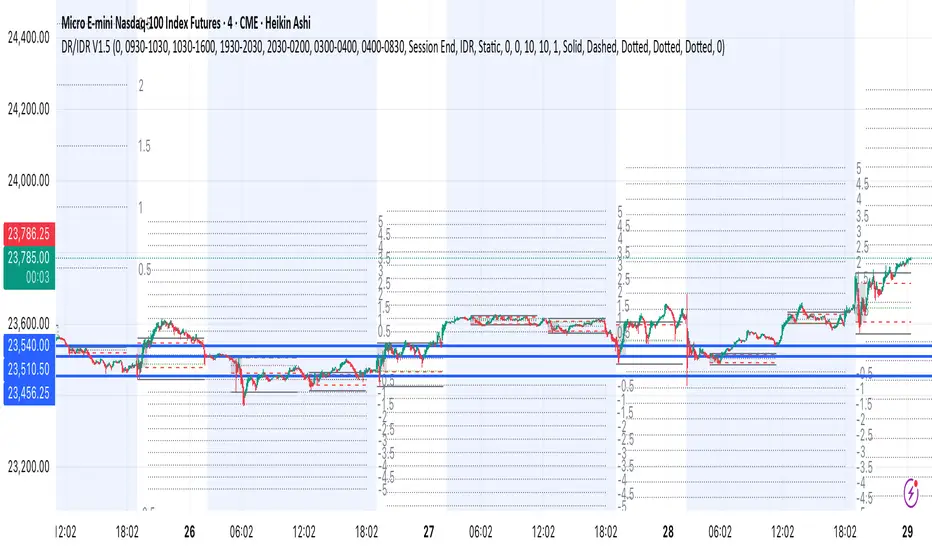
📍 Session Detection: Automatically marks Regular (RDR), After-hours (ADR), and Overnight (ODR) ranges.
📈 DR & IDR Lines: High, Low, and optional Mid lines for both DR and IDR.
🟩 Opening Line: Plots the session’s opening price with customizable extension options.
🎨 Visual Boxes: Highlights the DR/IDR area with customizable up/down coloring (based on candle open/close).
➕ Standard Deviation Lines: Plots levels at multiples of 0.5 × IDR, either dynamically (following price) or statically (fixed number of levels).
⏳ Extend Options: Extend ranges to session end, ADR end, ODR end, or dynamically follow price.
⚙️ Highly Customizable: Colors, line styles, box shading, visibility history, and extension behavior.
Usage:
Traders use this indicator to analyze liquidity, session ranges, and potential breakout or mean-reversion zones. The DR/IDR concept is often used in ICT-style trading to identify accumulation ranges and expansion phases. Standard Deviation lines help in spotting overextensions and possible reversal levels.
Скрипт с ограниченным доступом
Только пользователи, одобренные автором, могут получить доступ к этому скрипту. Вам нужно отправить запрос и получить разрешение на его использование. Обычно доступ предоставляется после оплаты. Для получения подробной информации следуйте инструкциям автора ниже или свяжитесь с Quantel_io напрямую.
TradingView НЕ рекомендует платить за скрипт или использовать его, если вы не доверяете его автору и не понимаете, как скрипт работает. Вы всегда можете найти бесплатные скрипты с открытым исходным кодом в Скриптах сообщества.
Инструкции от автора
Отказ от ответственности
Скрипт с ограниченным доступом
Только пользователи, одобренные автором, могут получить доступ к этому скрипту. Вам нужно отправить запрос и получить разрешение на его использование. Обычно доступ предоставляется после оплаты. Для получения подробной информации следуйте инструкциям автора ниже или свяжитесь с Quantel_io напрямую.
TradingView НЕ рекомендует платить за скрипт или использовать его, если вы не доверяете его автору и не понимаете, как скрипт работает. Вы всегда можете найти бесплатные скрипты с открытым исходным кодом в Скриптах сообщества.