OPEN-SOURCE SCRIPT
CVD with Trend Line
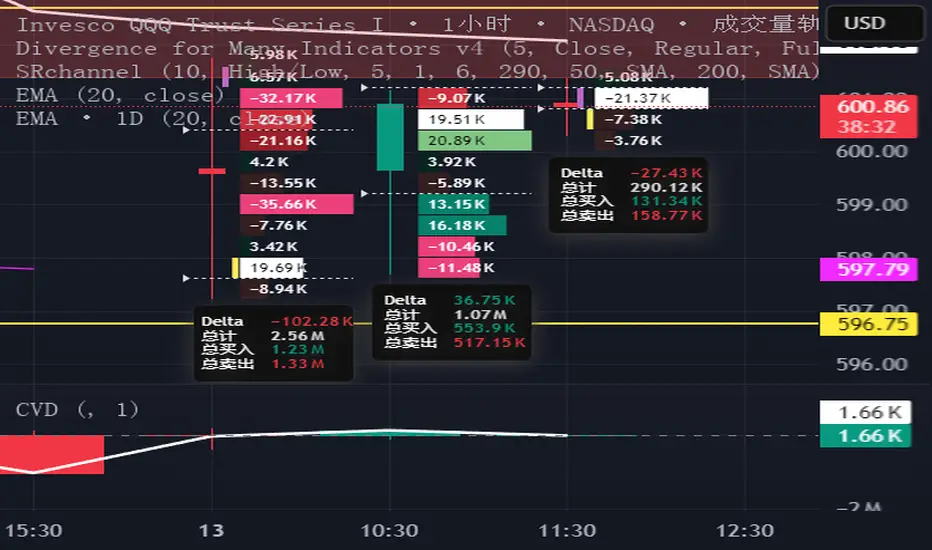
This indicator augments the traditional Cumulative Volume Delta (CVD) by incorporating a customizable trend line that connects the tops of the CVD histogram bars, enhancing visualization of delta trends and market momentum. The CVD measures the net difference between buying and selling volume, utilizing lower timeframe data for accuracy, with configurable anchor periods and timeframe options. The trend line, which can be tailored in both color and style (e.g., solid, dashed), provides traders with a flexible tool to track cumulative delta movements, aiding in the identification of market sentiment shifts. Perfect for volume-based analysis with a clear, adaptable display.
Скрипт с открытым кодом
В истинном духе TradingView, создатель этого скрипта сделал его открытым исходным кодом, чтобы трейдеры могли проверить и убедиться в его функциональности. Браво автору! Вы можете использовать его бесплатно, но помните, что перепубликация кода подчиняется нашим Правилам поведения.
Отказ от ответственности
Информация и публикации не предназначены для предоставления и не являются финансовыми, инвестиционными, торговыми или другими видами советов или рекомендаций, предоставленных или одобренных TradingView. Подробнее читайте в Условиях использования.