PROTECTED SOURCE SCRIPT
Bimmeresty's MACD

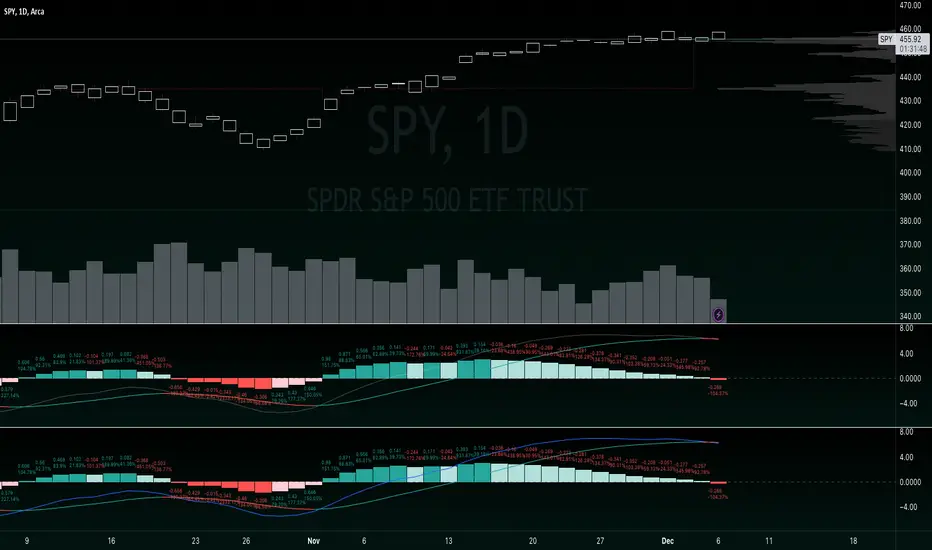
Improved MACD with labels on histogram and color change feature on signal line.
Labels on histogram help gauge how strong the change is rather than visually comparing heights.
example: "histogram just put in its first rising candle, but its only rising by 0.01 therefore i should be suspicious of it and possibly wait for a second rising candle for further confirmation of reversal"
Color change on signal slope is better for gauging the directional bias and spotting reversals.
example: "slope is red, so negative, so i should prioritize shorts"
example: "slope just turned green, so positive, so we might be reversing bias here"
Скрипт с защищённым кодом
Этот скрипт опубликован с закрытым исходным кодом. Однако вы можете использовать его свободно и без каких-либо ограничений — читайте подробнее здесь.
Отказ от ответственности
Информация и публикации не предназначены для предоставления и не являются финансовыми, инвестиционными, торговыми или другими видами советов или рекомендаций, предоставленных или одобренных TradingView. Подробнее читайте в Условиях использования.