RoseTree BTC Macro Liquidity
Why It's Unique
- Combines macro liquidity (M2) with BTC valuation.
- Not price-based — more about where BTC stands in the bigger economic picture.
- Useful for long-term, macro-aware investors looking for timing signals aligned with monetary expansion.
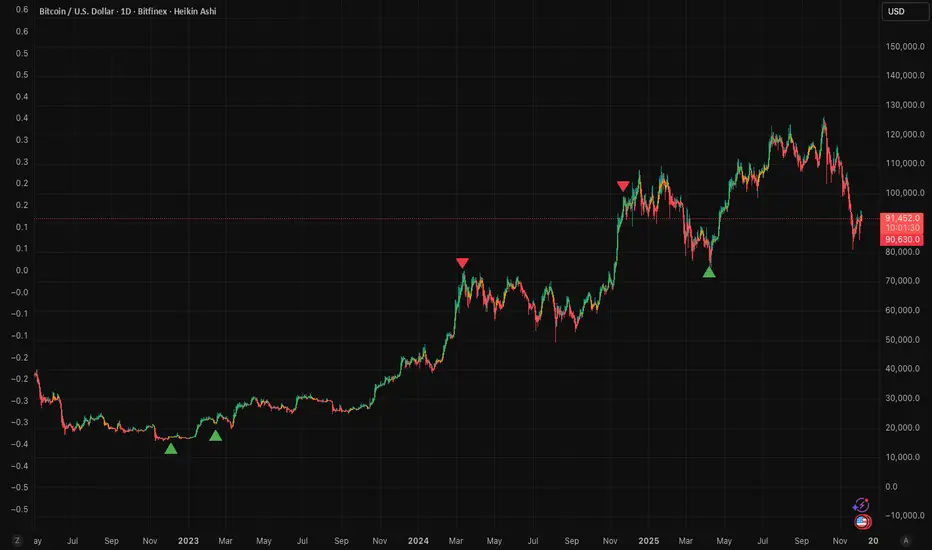
✅ Buy Signal (Green Triangle Below Bar)
M2 is expanding (liquidity increasing), AND
Bitcoin is undervalued compared to its historical relationship to M2
→ Suggests potential upside, triggers a green triangle below the bar.
❌ Sell Signal (Red Triangle Above Bar)
Bitcoin is significantly above its historical average share of M2
→ Suggests overvaluation or a short-term top, triggers a red triangle above the bar.
What is Global M2 Money Supply? (GLM2)
M2 is a measure of money supply, including cash, checking deposits, and easily convertible near money.
This indicator manually aggregates M2 values from numerous countries and converts them into USD equivalents using exchange rates.
The countries include the US, EU, UK, China, India, Japan, Brazil, and many others — totaling over 20.
This tells you how large Bitcoin is relative to the global money supply, giving a sense of its macroeconomic footprint or potential room to grow.
Скрипт с ограниченным доступом
Доступ к этому скрипту имеют только пользователи, одобренные автором. Вам необходимо запросить и получить разрешение на его использование. Обычно оно предоставляется после оплаты. Для получения подробной информации следуйте инструкциям автора ниже или свяжитесь напрямую с ZackBakos.
TradingView НЕ рекомендует оплачивать или использовать скрипт, если вы полностью не доверяете его автору и не понимаете, как он работает. Вы также можете найти бесплатные, открытые альтернативы в наших скриптах сообщества.
Инструкции от автора
Отказ от ответственности
Скрипт с ограниченным доступом
Доступ к этому скрипту имеют только пользователи, одобренные автором. Вам необходимо запросить и получить разрешение на его использование. Обычно оно предоставляется после оплаты. Для получения подробной информации следуйте инструкциям автора ниже или свяжитесь напрямую с ZackBakos.
TradingView НЕ рекомендует оплачивать или использовать скрипт, если вы полностью не доверяете его автору и не понимаете, как он работает. Вы также можете найти бесплатные, открытые альтернативы в наших скриптах сообщества.