OPEN-SOURCE SCRIPT
Absolute Momentum Indicator
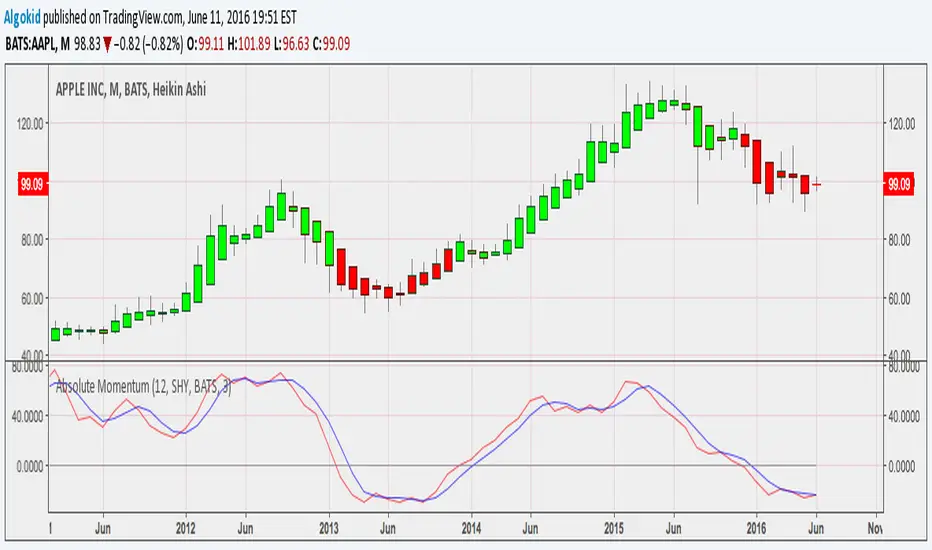
Covered intensevely by Gary Antonnacci in his paper " Absolute Momentum : A simple Rule Based Strategy and Universal Trend Following Overlay , Absolute momentum buys asset with excess return, which is calculated by taking the return of the asset for a giving period of time LESS the Treasury bill rate . The following indicator is based on the rules found in the paper. However you have the liberty to choose your time frame and symbol to calculate the excess return .
Read more about this indicator here
Cheers
Read more about this indicator here
Cheers
Скрипт с открытым кодом
В истинном духе TradingView, создатель этого скрипта сделал его открытым исходным кодом, чтобы трейдеры могли проверить и убедиться в его функциональности. Браво автору! Вы можете использовать его бесплатно, но помните, что перепубликация кода подчиняется нашим Правилам поведения.
Отказ от ответственности
Информация и публикации не предназначены для предоставления и не являются финансовыми, инвестиционными, торговыми или другими видами советов или рекомендаций, предоставленных или одобренных TradingView. Подробнее читайте в Условиях использования.