PROTECTED SOURCE SCRIPT
Обновлено Index Volume

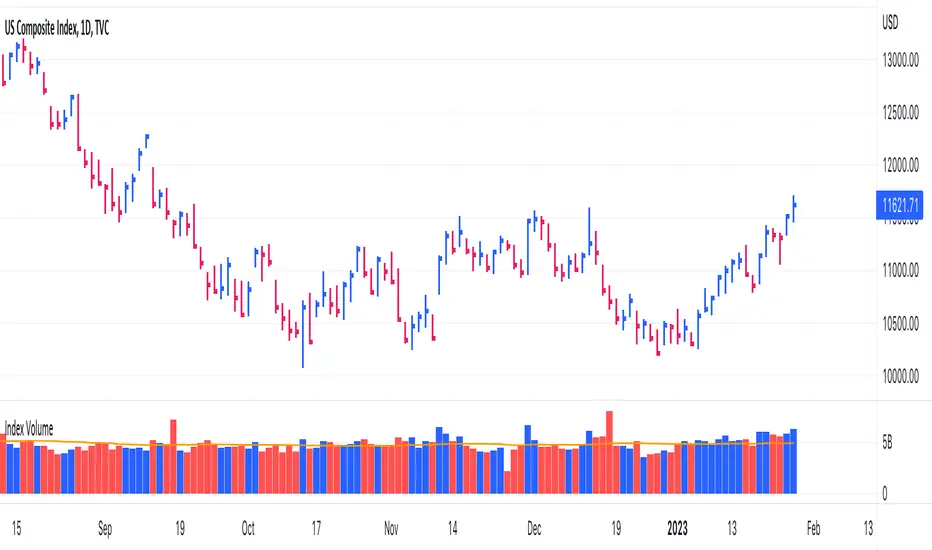
This indicator displays the volume for the Nasdaq Composite and S&P500 indexes just like any other stock. Also displays any normal stock volume as well. Customizations include choice of colors and moving average length.
Информация о релизе
New option to automatically plot a diamond on follow through and distribution days. Also have the ability to show distribution clusters. (4 distribution days in a rolling 8 day window) Информация о релизе
Cleaned up the status line display to only show Volume and Volume AverageИнформация о релизе
Added ability for volatility adjusted follow through days, as defined in IBD's Market School. - Volatility defined as the average percentage gain of the up days over the prior 200 days.
- Volatility less than or equal to 0.4%, follow-through must close up 0.7% or higher.
- Volatility greater than or equal to 0.4% and less than 0.55%, follow-through must close up 0.85% or higher.
- Volatility greater than or equal to 0.55% and less than 1.00%, follow-through must close up 1.00% or higher.
- Volatility greater than or equal to 1.00%, follow-through must close up 1.245% or higher.
Информация о релизе
Updated volume source for the indexes, should update in real time now. Информация о релизе
Update shows volume run rate on stocks. Скрипт с защищённым кодом
Этот скрипт опубликован с закрытым исходным кодом. Однако вы можете использовать его свободно и без каких-либо ограничений — читайте подробнее здесь.
Trusted Pine programmer. Send me a message for script development.
Отказ от ответственности
Информация и публикации не предназначены для предоставления и не являются финансовыми, инвестиционными, торговыми или другими видами советов или рекомендаций, предоставленных или одобренных TradingView. Подробнее читайте в Условиях использования.
Скрипт с защищённым кодом
Этот скрипт опубликован с закрытым исходным кодом. Однако вы можете использовать его свободно и без каких-либо ограничений — читайте подробнее здесь.
Trusted Pine programmer. Send me a message for script development.
Отказ от ответственности
Информация и публикации не предназначены для предоставления и не являются финансовыми, инвестиционными, торговыми или другими видами советов или рекомендаций, предоставленных или одобренных TradingView. Подробнее читайте в Условиях использования.