OPEN-SOURCE SCRIPT
Anand Bollinger Bands - Linear Regression Slope
Summary
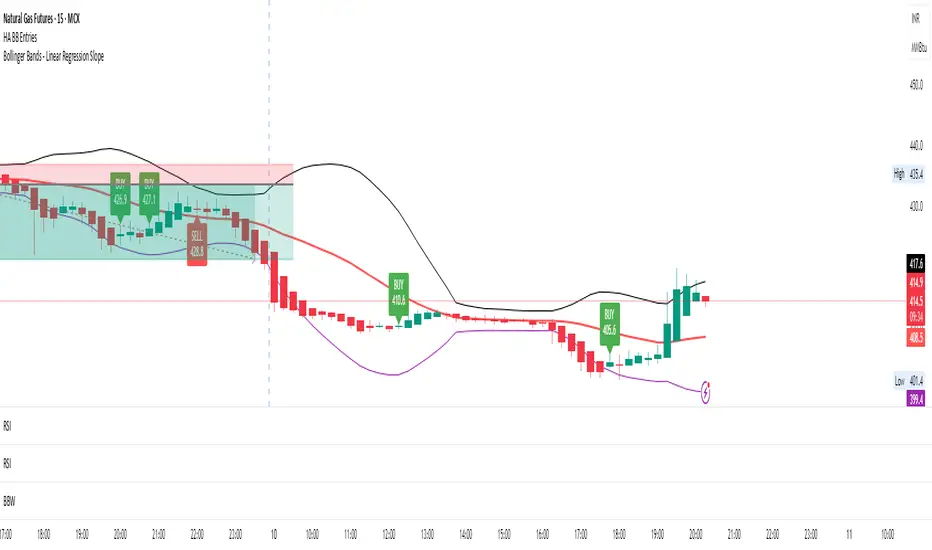
Bollinger Bands show price volatility using SMA ± standard deviation
Linear Regression calculates the mathematical trend through the middle line
Slope comparison (current vs. previous) determines if trend is rising or falling
Color changes based on that trend: Green = up, Red = down
Uses same period for both BB and slope = everything stays synchronized
The result: A visual indicator that shows you not just where price is relative to volatility, but also which direction the trend is actually moving!
Скрипт с открытым кодом
В истинном духе TradingView, создатель этого скрипта сделал его открытым исходным кодом, чтобы трейдеры могли проверить и убедиться в его функциональности. Браво автору! Вы можете использовать его бесплатно, но помните, что перепубликация кода подчиняется нашим Правилам поведения.
Отказ от ответственности
Информация и публикации не предназначены для предоставления и не являются финансовыми, инвестиционными, торговыми или другими видами советов или рекомендаций, предоставленных или одобренных TradingView. Подробнее читайте в Условиях использования.